
Ultrasound techniques are becoming increasingly important in equine reproduction, offering both a means of diagnosis and a useful therapeutic tool. Accordingly, understanding the use of ultrasound technology is critical in contemporary animal sciences, since ultrasound examinations are now a routine component of diagnostic workups in reproduction. Ultrasound is commonly used to monitor uterine anatomy, involution and pathology. In addition, it has been used to detect pregnancy, study embryonic mortality, monitor foetal development, and determine foetal sex.
Anestrus : Phase of the mare's reproductive cycle characterized by inactivity of the ovaries. Seen most commonly during the nonbreeding season.
Corpus Luteum : A glandular mass in the ovary formed by an ovarian follicle that has matured and discharged its ovum. The corpus luteum secretes progesterone.
Diestrus : A period of sexual quiescence occurring between consecutive estrous periods in the mare.
Embryo : The developing organism, beginning with the fertilized ovum and continuing to the fetal stage.
Endometritis : Inflammation of the endometrium (lining of the uterus).
Estrus : (Heat) That portion or phase of the estrous cycle of the mare characterized by willingness to accept the stallion.
Fetus : The developing organism after the major organs (e.g. heart) form and continuing to birth.
Megahertz (MHz) : One million sound waves per second
Pregnancy : The condition of having a developing embryo or fetus in the body after union of an ovum and spermatozoon.
Transducer : The portion of an ultrasonographic unit that contains piezoelectric crystals that vibrate to produce ultrasound.
Ultrasonography : The use of ultrasound to allow visualization of deep structures of the body by recording reflections of echos of ultrasonic waves propagated and reflected by tissues.
Ultrasound : Mechanical radiant energy with a frequency greater than 20,000 cycles per second.
Ultrasound imaging is a diagnostic medical procedure that uses high-frequency sound waves to produce dynamic images (sonograms) of organs, tissues or blood flow inside the body. Ultrasonography is an advanced form of acoustic sensing in which high frequency sound waves are transmitted into the body, reflected back and displayed as a video image.
Ultrasound imaging is a diagnostic medical procedure that uses high-frequency sound waves to produce dynamic images (sonograms) of organs, tissues or blood flow inside the body. Ultrasonography is an advanced form of acoustic sensing in which high frequency sound waves are transmitted into the body, reflected back and displayed as a video image. Sound waves of frequencies (Frequency is measured in Hertz (Hz) and indicates the number of cycles per second (cps)) more than audible to human ear (> 20,000 Hz) are called ultrasound. Frequencies between 2 to 10 MHz are used in diagnostic ultrasound. Selection of frequency is inversely related to the depth of the tissue from scan surface. Diagnostic ultrasound works on pulse-echo principle. A pulse is generated by one or more piezoelectric crystal in an ultrasound transducer. As the transducer is placed in close contract with the body surfaces through a coupling medium (gel), a portion of the ultrasound beam reflected back towards the source in the form of echo which is converted into visual image by the computer of the ultrasound machine.
An ultrasound wave is generated when an electric field is applied to an array of piezoelectric crystals located on the transducer surface. Electrical stimulation causes mechanical distortion of the crystals resulting in vibration and production of sound waves. The sound waves emitted from the transducer are transmitted into the body, reflected off the tissue interface and returned to the transducer. These are then converted into an electric signal, which is processed and displayed as an image on the screen. The conversion of sound to electrical energy is called the piezoelectric effect.
There are three modes of ultrasound machines viz. A mode, B mode and M mode A mode is amplitude mode and depicted as line graph Amplitude mode (A-mode) ultrasound imaging is a single dimensional display of the amplitude and distance of the returning echo. The returning echoes are displayed as spikes or peaks originating from a horizontal baseline; the height of the peak is proportional to the amplitude of the returning echoes. Echo depth is represented by the location of the spikes on the baseline. Because more time is required for the echoes to return from deeper structure, the spikes of deeper echoes are seen further down the baseline.
One dimensional display of echo, fat and lean (meat animals) thickness measurement B mode is brightness modality and most of the ultrasound scanners used in equine/bovine reproductive research are linear array B- mode. It is a two dimensional display in the form of dots. The transducer is moved across the surface of the body and the cross sectional anatomy is depicted. The returning echoes are displayed on the ultrasound screen as series of grey dots. The brightness of the dots is proportional to the amplitude of the returning echoes while the location of each dot corresponds to the anatomic location of the echo generating structure.
M mode The motion mode (M-mode) is used for imaging the moving structures such as heart It gives 1-D image with vertical axis- depth and horizontal axis- time. With M-mode, the transducer is held in place over the moving organ and the display is printed on a oscilloscope or moving strip of light sensitive paper. M-mode is used primarily in echocardiographic studies of heart to measure cardiac wall motion and valve excursions.
Echo Ultrasound waves are produced by the transducer and directed towards the region of interest by holding the transducer above the area. Part of the sound waves will be absorbed by the tissue, and part will be reflected. The reflected portion produces the "echo" which is received by the transducer. Homogenous media produce many echoes, which are echogenic areas, or no echoes, which are echo free or anechoic areas. Echo poor tissues, such as edematous tissues, have scattered echoes. Solid tumors are echo rich tissues and produce many echoes at medium sensitivity. Fluid is an echo free media and appears black on the screen, while bone is echogenic and appears white. Tissues distant to a cystic region (fluid filled) will appear hyper echogenic due to large numbers of sound waves passing through the fluid.
Different structures emit different signals on ultrasound imaging, which are termed as echogenicities. Echogenicity of the tissue refers to the ability to reflect or transmit US waves in the context of surrounding tissues. Based on echogenicity, a structure can be characterized as hyperechoic (white on the screen), hypoechoic (gray on the screen) and anechoic (black on the screen). Hyperechoic structures appear white and bright on the ultrasound image, while isoechoic have the same density as the surrounding structures and appear grey. Hypoechoic structures appear dark, black and produce a weak signal
Ultrasonography has been demonstrated to be a technological breakthrough in the diagnostics of modern assisted reproduction. Ultrasonography offers several advantages as a technique for rapid non-invasive evaluation / visualization of reproductive organs as compared with other invasive techniques like endometrial biopsy, endoscopy and transvaginal palpation. Ultrasonography in the veterinary profession has gained significant value in the gynecological examination of mares and in contrast to rectal examination, which permits a much earlier and more accurate diagnosis of pregnancy and provides relevant practical information about many other conditions of the genital tract.
- Ultrasound technology offers the assessment of pregnancy status and foetal viability early post breeding in order to identify animals that fail to conceive, improving reproductive efficiency
- Early identification of animals carrying twin foetuses, allowing for the implementation of differential management strategies to avoid the negative effects of twinning on general health of the mother animal and also at parturition
- The visualisation of ovarian and uterine pathologies not accurately detected via rectal palpation, allowing appropriate therapies to be implemented.
- In addition, determination of foetal sex in utero can be done by ultrasonography.
A transducer is a device that converts energy from one type to another. In sonography, the transducer sends high frequency sound waves and then receives them back.
The two major types of real-time Ultrasonographic transducers used for reproductive examination of the mare are linear and sectorial.
Linear - widely used in the field of reproduction in large animals for transrectal purpose.
Convex/sector - resolution similar to linear array used in transabdominal and transvaginal purposes.
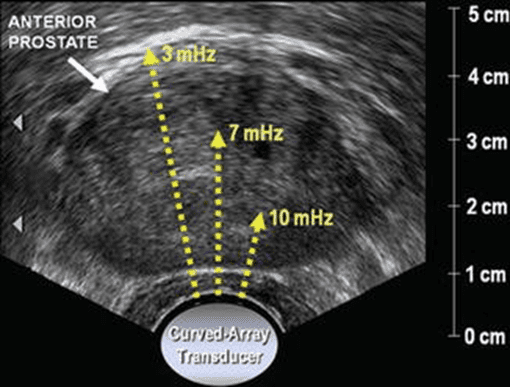
Transducers of various frequencies produce different penetrating power. Frequencies range from 1-25 MHz; frequencies of 3.5, 5.0, and 7.5 MHz are most common. High frequency transducers produce short, high frequency wavelengths (i.e. 7.5 MHz) and scan shorter distances with clearer resolution6 Lower frequency transducers produce longer wavelengths with greater beam penetration. Although these transducers can scan at greater depths, resolution is reduced
| Frequency (MHz) | Period (µS) | Wavelength | Imaging Depth |
|---|---|---|---|
| 2.0 | 0.50 | 0.77 | 30.0 |
| 3.5 | 0.29 | 0.44 | 17.0 |
| 5.0 | 0.20 | 0.31 | 12.0 |
| 7.5 | 0.13 | 0.21 | 08.0 |
| 10.0 | 0.10 | 0.15 | 06.0 |
Manual palpation should be followed by a systematic ultrasound evaluation of the entire reproductive tract. The rectum should be free of fecal material prior to the ultrasound examination. Obstetrical lubricant is applied to the ultrasound probe and hand, and the probe is introduced into the rectum in the palm of the examiner’s hand. A systematic examination of the reproductive tract should be performed. The transducer should be protected by the examiner's hand to prevent trauma to the rectal wall, and the transducer should be well-lubricated. Care should be taken to avoid fecal material attaching to the transducer. A plastic sleeve should be placed over the examiner’s arm and water soluble lubricant applied liberally to the arm. It is desirable to cover the transducer with a plastic sleeve to facilitate clean-up of the equipment and prevent damage to the transducer. After evacuating fecal material from the rectum, the probe is introduced and moved across the reproductive tract in the following pattern: uterine body, right uterine horn, right ovary, right uterine horn, uterine body, left uterine horn, left ovary, left uterine horn, uterine body then cervix (Figure 1).
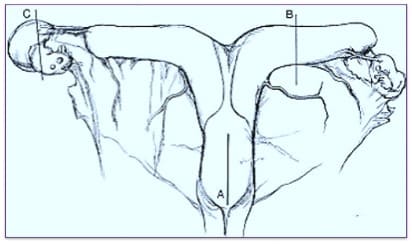
Fig 1 : Diagram showing orientations of linear transducer over the reproductive tract of the mare during examination per rectum.
- A. when the transducer is on the cervix and body of the uterus a longitudinal image is produced
- B. Uterine folds and uterine horn seen in short axis cross section
- C. Transducer on ovary allows to see follicles and corpus luteum in cross sections cut in different planes
Good contact must exist between the transducer and rectal wall. Air in the rectum or a gas or fluid-filled loop of bowel will result in a distorted image. To minimize scanning errors, principally those of omission, it is recommended to conduct the same scanning procedure during each examination.
When examining the mare’s ovary, the probe should be rotated slowly as the image is viewed on the screen. One should rotate the probe back and forth across the ovary once or twice to insure that each follicle is viewed individually (Figure 2).
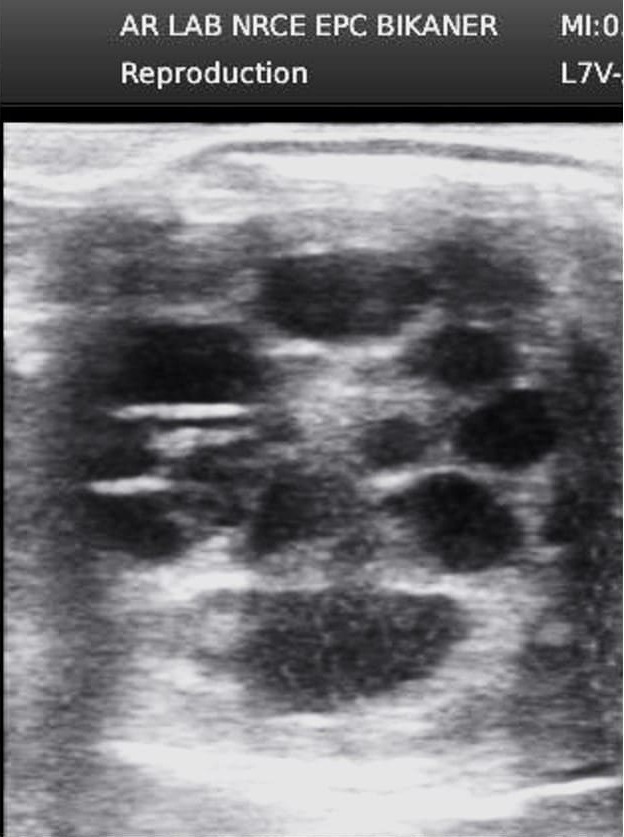
Fig. 2A Typical picture of ovary during anestrus condition. Picture shown here to get a glimpse how ovary looks on ultrasound examination
In many cases, a slight rotation of the probe will allow visualization of follicles that are in close proximity. It is not necessary to physically stabilize the ovary with the hand during scanning of the ovary. Generally, the operator removes the fecal material from the mare’s rectum and very quickly evaluates the size and tone of the uterus and locates the position of both ovaries by palpation only. Care should be taken to insure that good contact exists between the transducer and rectal wall and that air in the rectum, gas or fluid-filled loops of bowel do not interpose themselves between the transducer and the organ that is being evaluated. Appearance of ovary during various stages of estrus are being presented in the Figures 2A-2E.
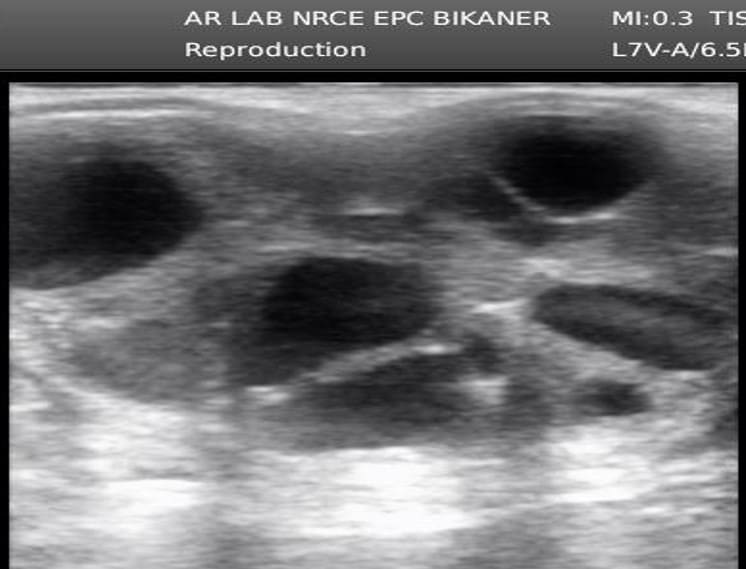
Fig 2b
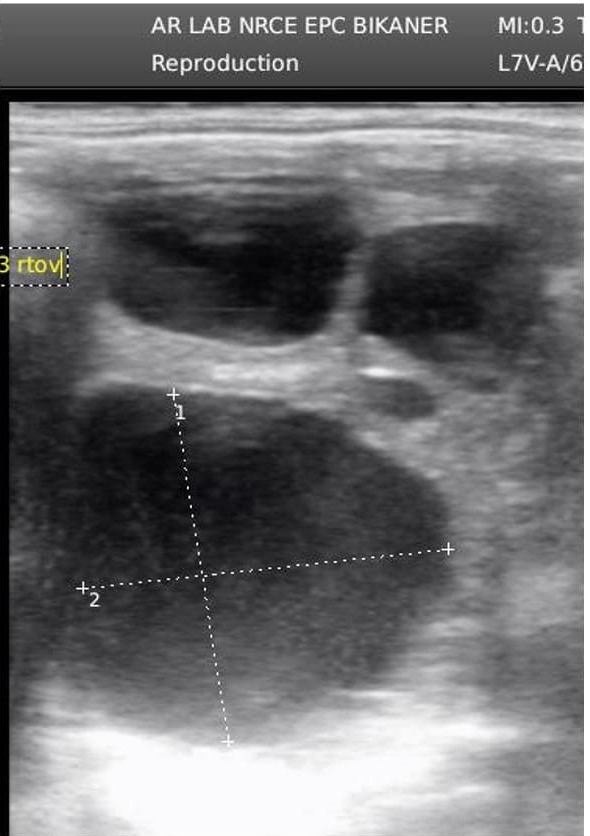
Fig. 2C Typical picture of ovary with developing follicle during mid estrus.

Fig 2d
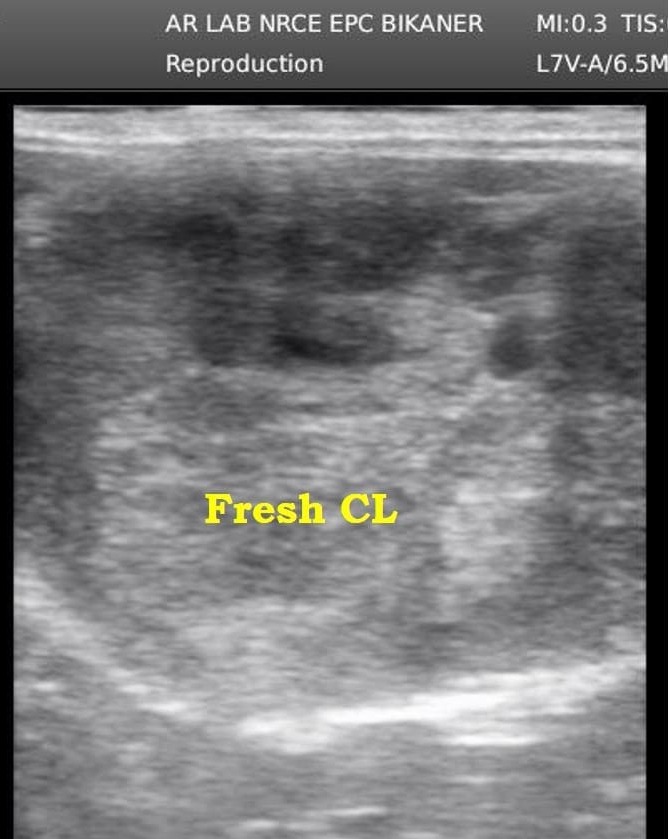
Fig. 2E Typical picture of ovary with corpus luteum indicating fresh ovulation.
Follicles, like other fluid-filled body structures, are non-echogenic and appear as black, roughly circular ultrasound images (Figure. 3 A&B).
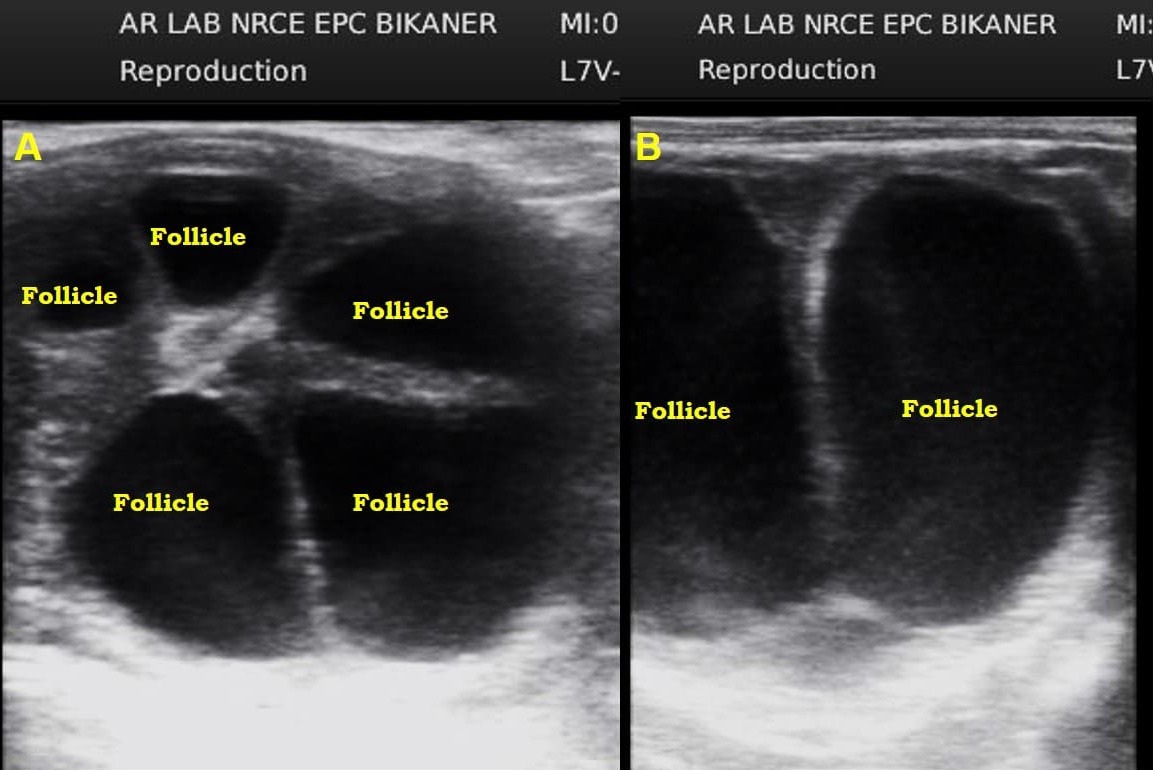
Fig. 3. Appearance of different types of follicles on ultrasound examination. Follicles appear like fluid-filled body structures, are non- echogenic and appear as black. A. Follicles during early estrus B. Twin follicles
Compression by adjacent follicles, luteal structures or ovarian stroma often can result in irregularly shaped follicles. The opposed walls of adjacent follicles are often straight. Diameter can be estimated by adjusting an irregularly shaped follicle to an approximately equivalent circular form. During the anestrous season, the ovaries are small and inactive and contain only small follicles (2-5 mm; Figure 2A).
However, in a small percentage of mares, a corpus luteum may be visualized by ultrasound during the anestrous season and with an ovulatory follicles (Figure. 3C &D).
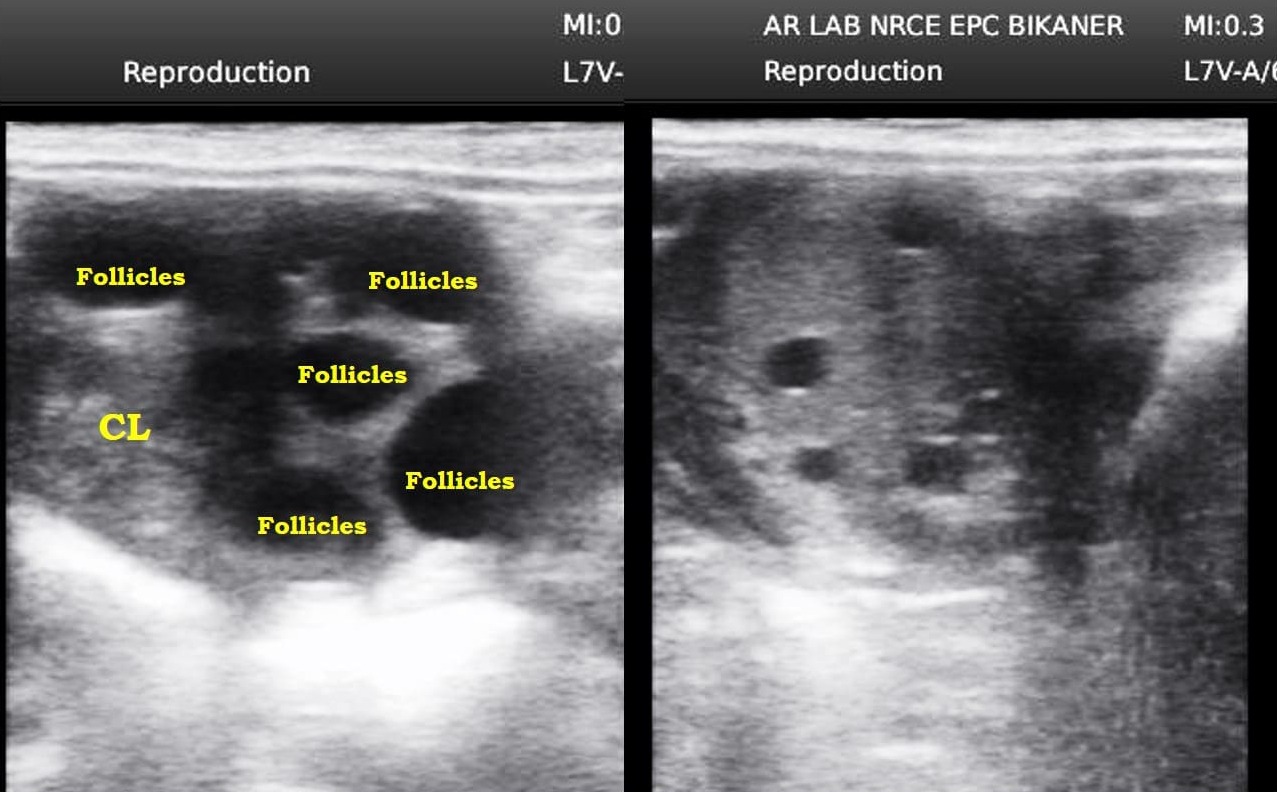
Fig 3C. Follicles with CL is seen in some mares during anestrus period.
Fig 3D. An ovulatory Follicles with CL is seen in some mares during anestrus period or transition period.
Follicular Dynamics
Ultrasonography is useful for monitoring dynamic follicular and luteal changes of equine ovaries, since it permits rapid, visual, non-invasive access to the reproductive tract. A 5 MHz transducer has greater resolution and is more suitable for evaluation of ovaries than a 3 or 3.5 MHz transducer. Follicles as small as 2 to 3 mm can be seen (Figures 5A and 5B).
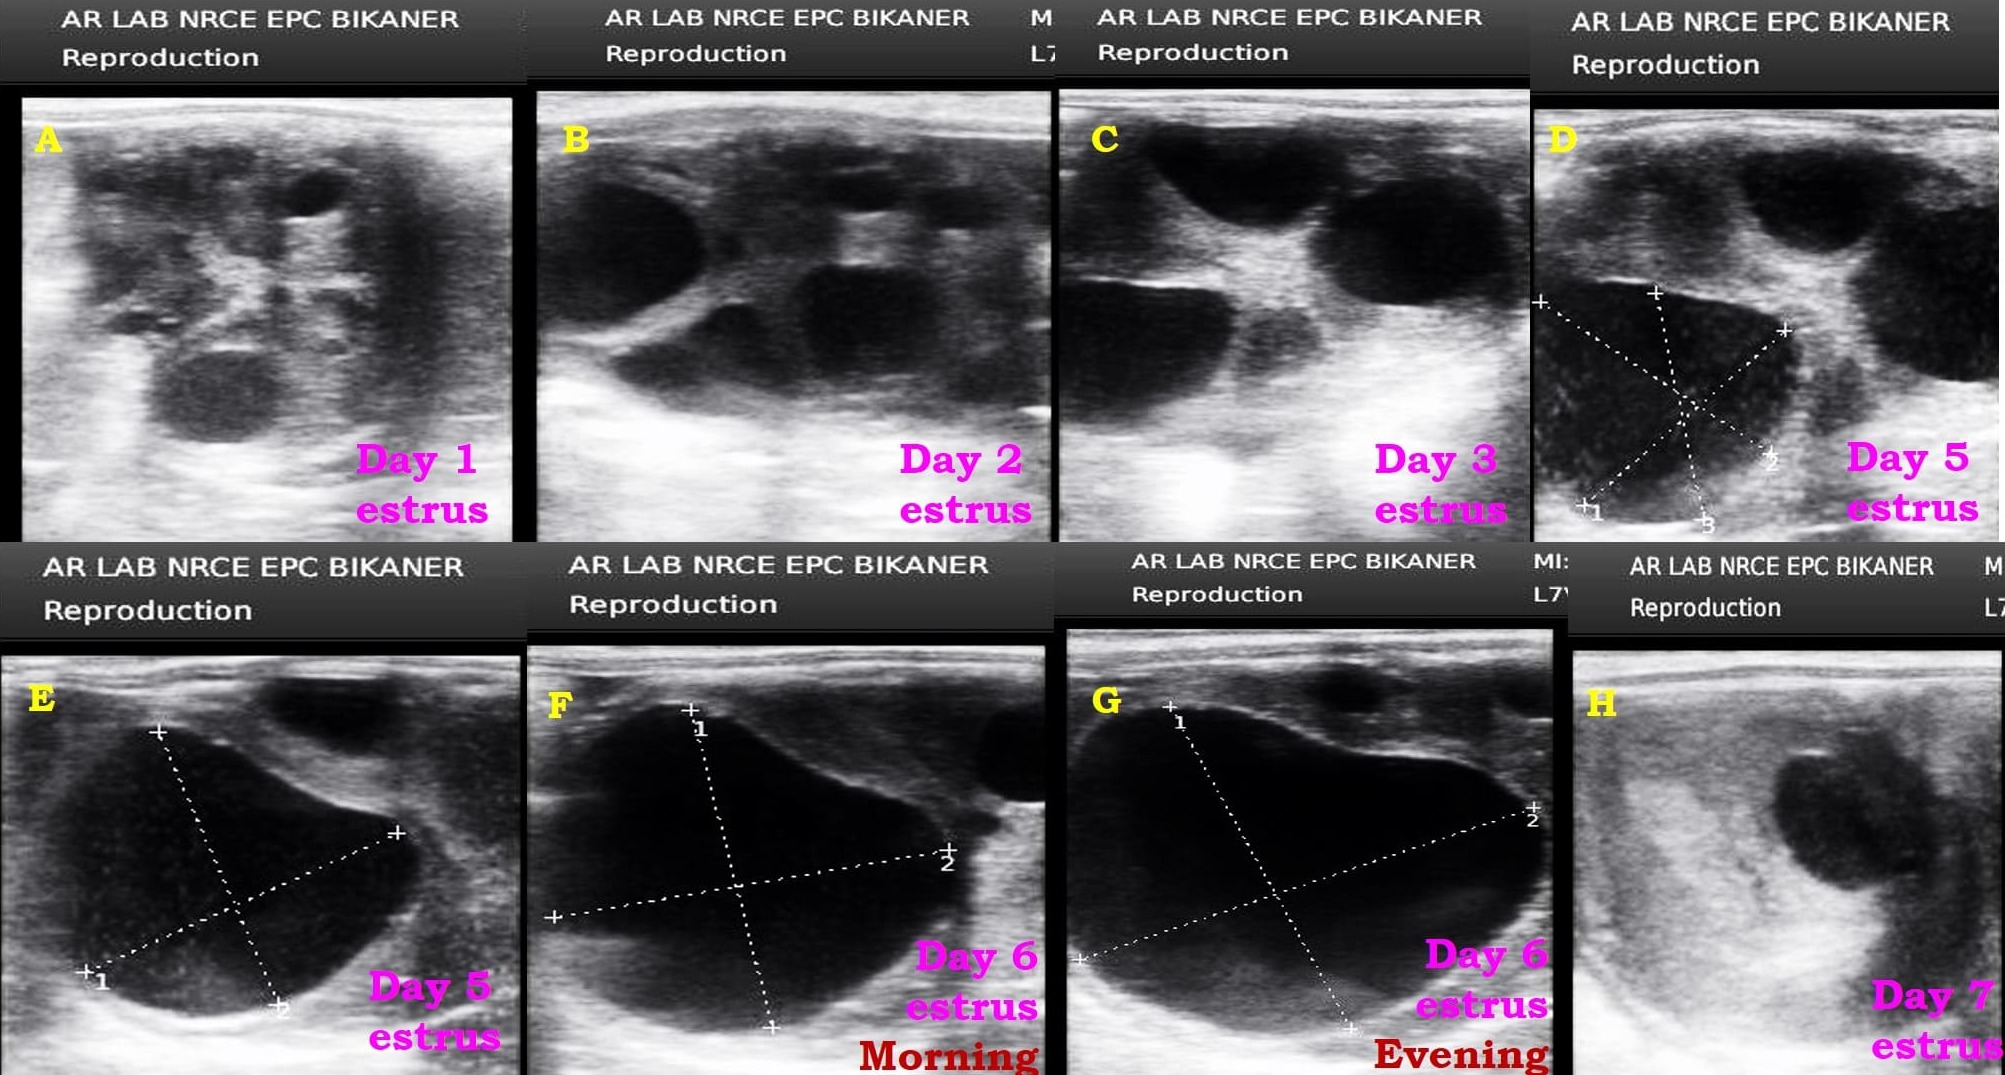
Fig 5. Follicular dynamics during estrus in mare.
Fig 5A-H. Appearance of follicles on ovary during estrus from emergence, development and deviation till ovulation
- estimating stage of estrous cycle,
- assessing preovulatory follicles,
- determining ovulation,
- examining the CL, and
- diagnosing ovarian abnormalities and pathology
On examination per rectal, first day of the oestrus, the size of the growing follicle (graffian follicle) would be 15-25 mm with very slight softness. The size and softness of graffian follicle increases gradually during the estrus period as the time of ovulation approaches (5A-H). By the 5 and 6th day of estrus, the graffian follicle attains the size of 40-45 mm along with increased softness (Figure 5 E-G). Ultrasonography will reveal the size of the developing graffian follicle and will also reveal if there is development of two graffian follicles (Figure. 6). Increase in the size along with increase in softness of the graffian follicle gives a hint, which is useful in predicting ovulation within a period 24 hours.
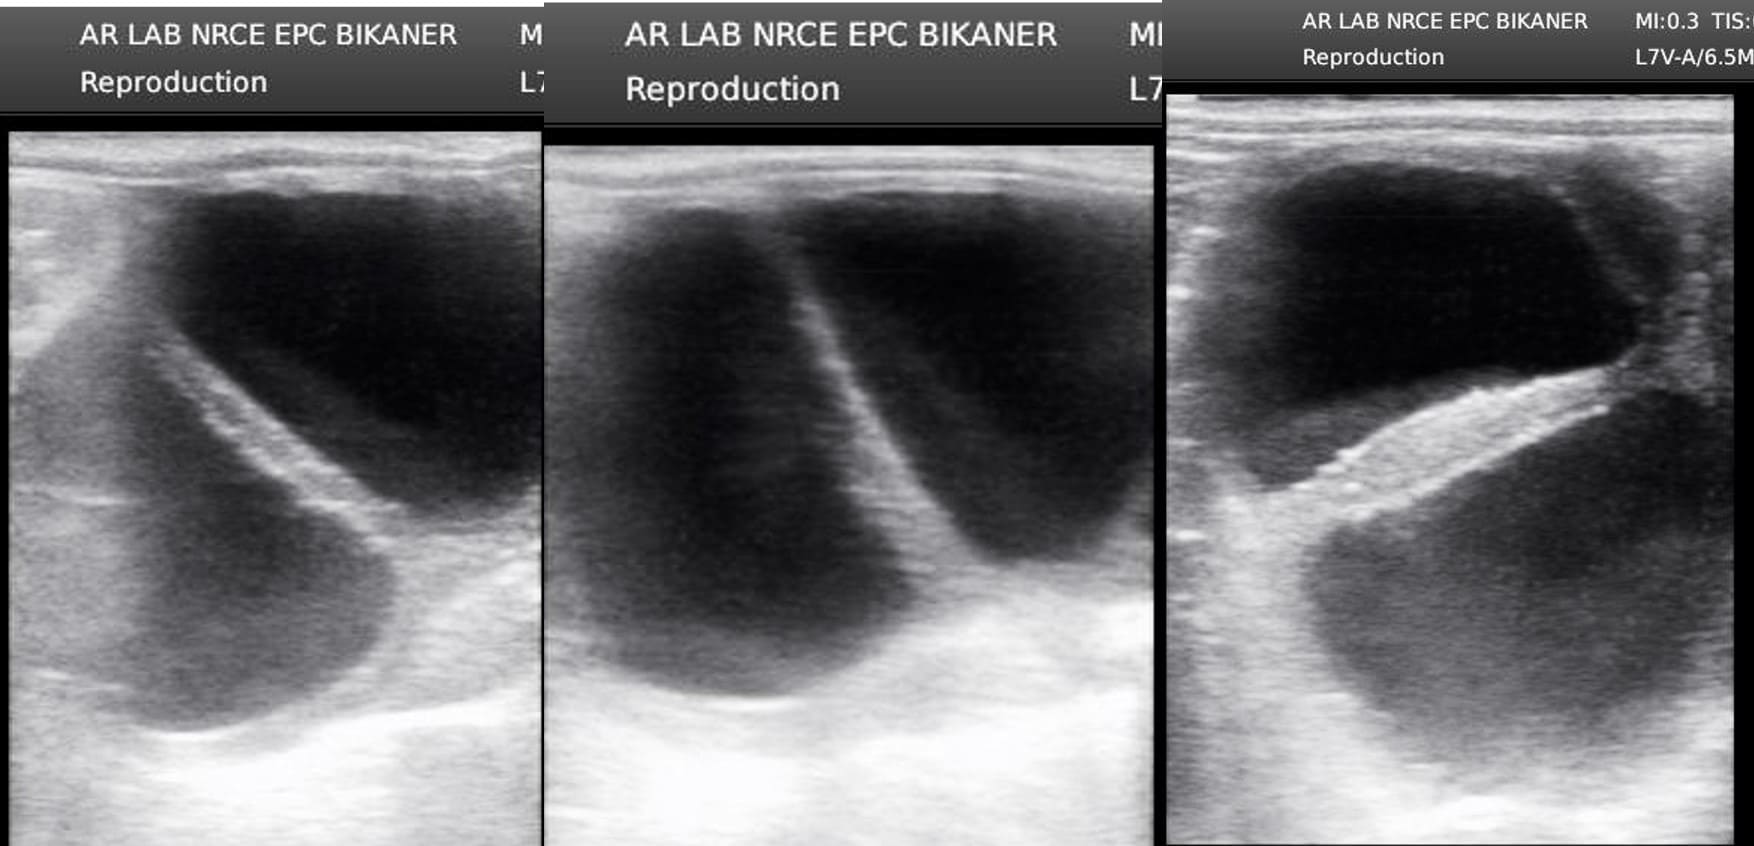
Fig 6 Development of two graafian follicles
Preovulatory Follicle
Ultrasonographically, this is frequently associated with a change in follicular shape from spherical to pear or irregular shapes (Figure 4A &B), which may be due to disruption of ovarian stroma as the follicle progresses toward the fossa in preparation for ovulation, i.e. oocyte release. Thickening of the follicular wall occurs in most preovulatory follicles prior to ovulation (Figure 7). However, it generally occurs too early to be an adjunct to predicting ovulation. Increased echogenicity of follicular fluid is sometimes seen prior to ovulation (Figure 4), perhaps due to degeneration and subsequent shedding of granulosa cells from the follicular wall. This can be an indicator of impending ovulation, although it is neither common nor consistent enough to be particularly diagnostic. Prior to ovulation, some follicles develops a tear in the follicular wall, which may be characterized by a jagged protrusion of the follicular border toward the ovulation fossa. Various characteristics can be used, within certain limitations, to predict time of ovulation. Softening of the follicle commonly occurs within 24 hrs of ovulation in approximately 70% of mares. A bright echogenic border, irregular shape and a tear in the follicular wall were predictive of imminent ovulation (Figures 4 and 7).
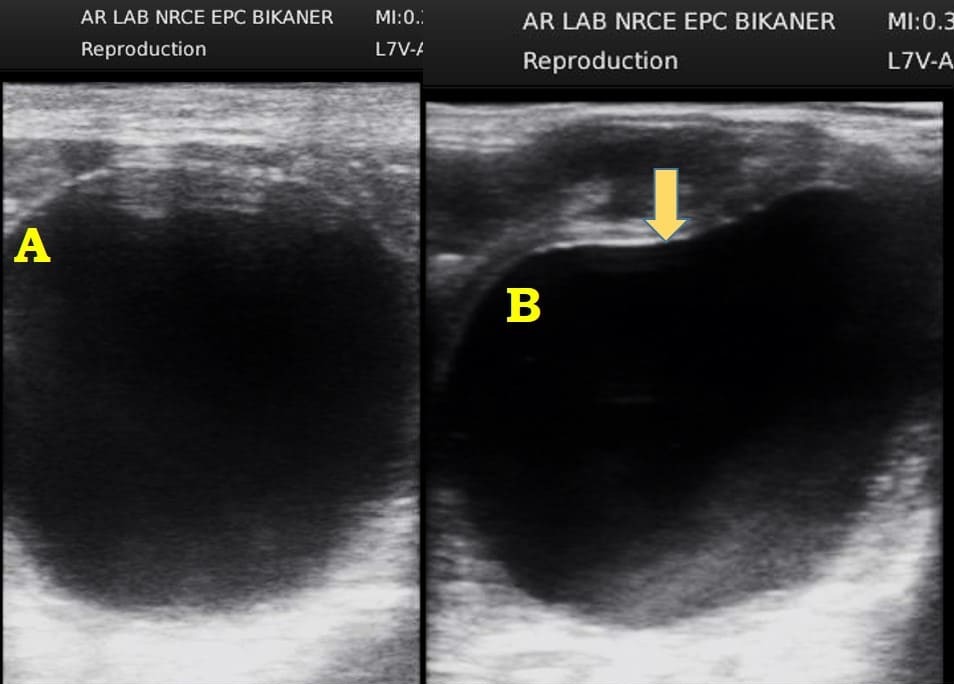
Fig. 4. Ovarian follicles. The shape of the follicle deviates from A. spherical to the B. irregular or indented towards ovulatory fossa. The larger follicle is developing a thickened echogenic border (arrow). Note the thickened borders of the follicular wall, loss of round shape, and conical appearance near the center of the ovary (i.e., near the ovulation fossa).
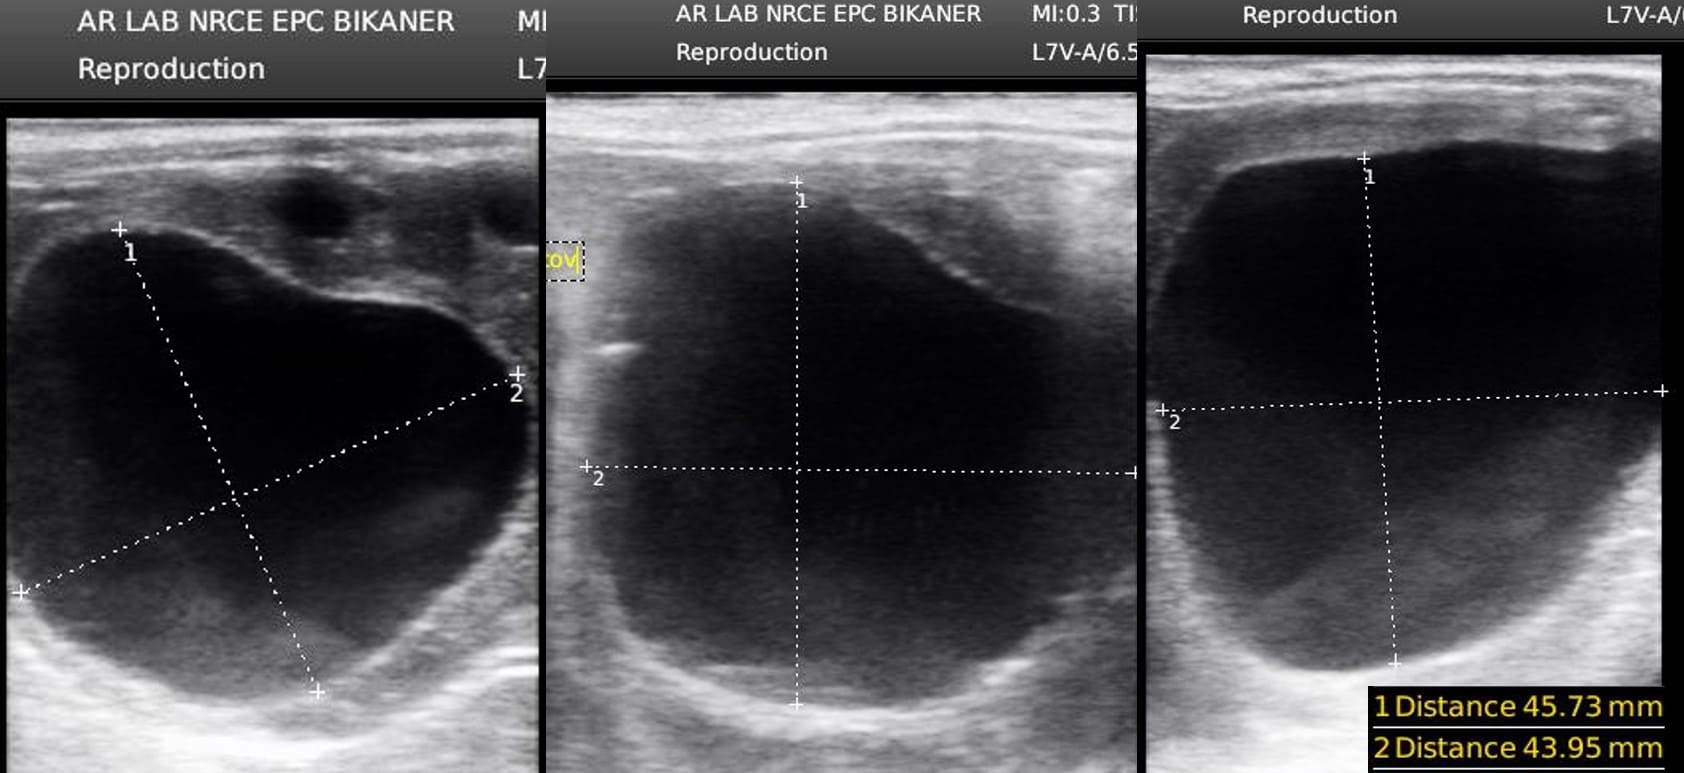
Fig 7 Pre-ovulatory follicles. Notice the thickening (arrows) of the follicular wall
Ovulation
Ovulation was defined as a rapid decrease in follicular size characterized by disappearance of the large, fluid filled, non-echogenic structure. A real-time, B-mode, linear array scanner with a 5 MHz transducer can be used for ultrasonographic examinations. Increased echogenicity of the follicular wall was visualized in all follicles prior to ovulation (Figures 4-7). Appearance of echogenic "spots" within the follicular fluid, probably due to dispersal of granulosa cells, may be observed in some follicles. However, echogenic "spots" within follicular fluid, or a bright, echogenic follicular border, were not consistently useful in predicting time of ovulation (Figure 8).
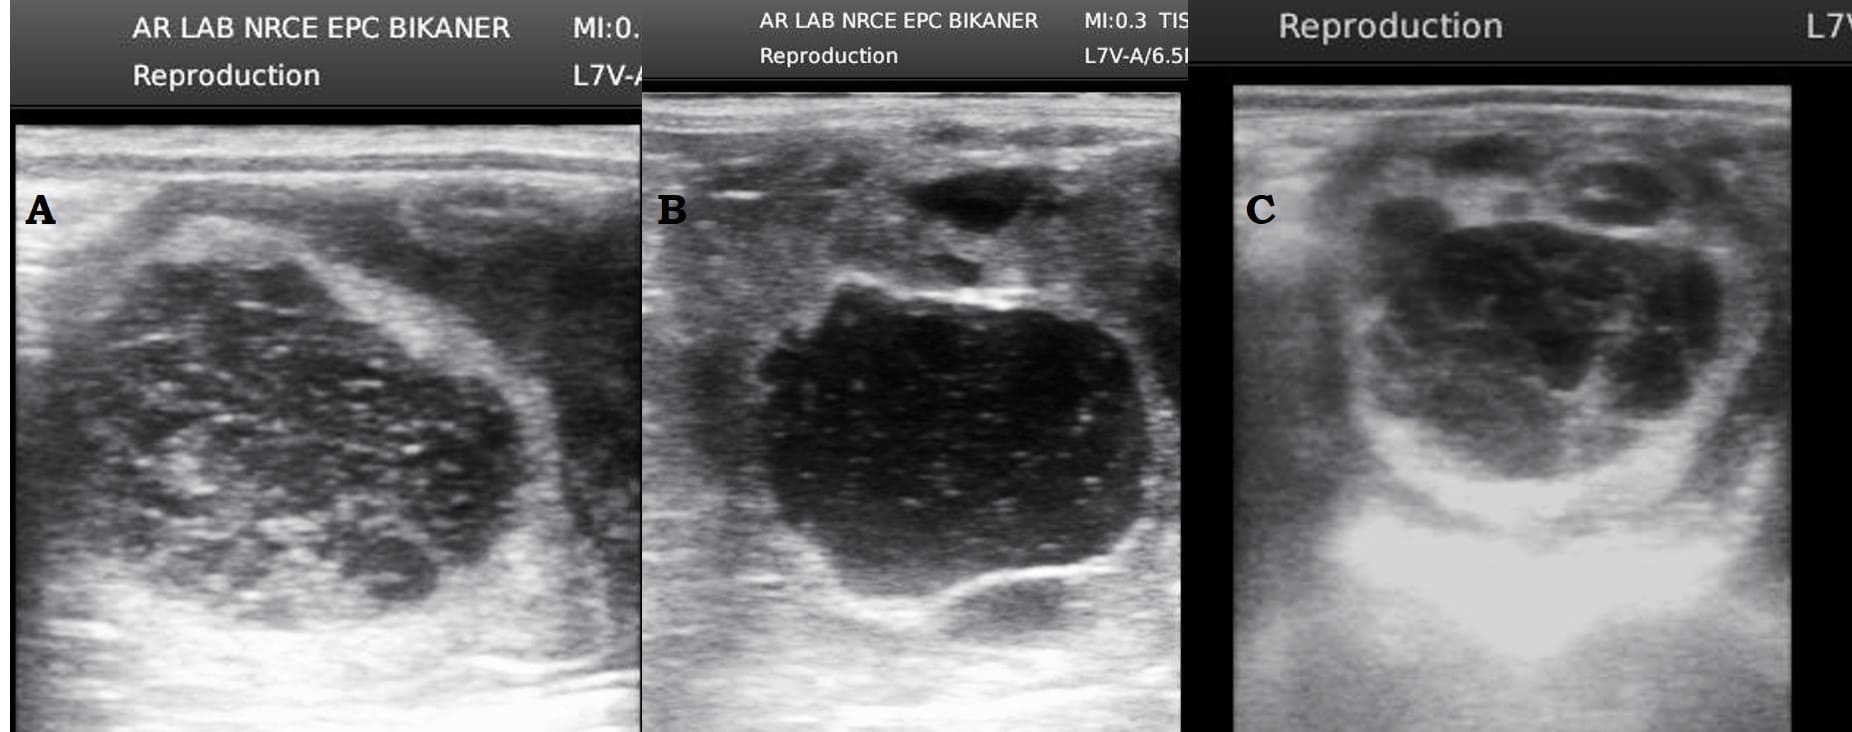
Fig 8 Ultrasonographic image of a hemorrhagic anovulatory follicle. Fluid in the follicle is slightly echogenic (white speckling) and the follicular wall (arrows) is greatly thickened.
Anovulatory follicles
Anovulation is considered a common and normal phenomenon during transitional estrus in the spring or fall; however, it occurs infrequently during the ovulatory season and is considered abnormal during that time. The cause of anovulation during the ovulatory season is not known. Although some anovulatory follicles simply seem to regress, they more commonly are considered to become hemorrhagic (i.e., hemorrhagic follicle) and are characterized ultrasonographically as large (sometimes 6-cm to 10-cm in diameter) hypoechoic follicular structures that gradually begin to show echogenic specks within the follicular antrum. They may have a highly echogenic rim, possibly associated with some luteinization of the follicular wall (Figure 8). Maximal size is usually reached during this apparent consolidation process. After the structure ceases growing, organization becomes apparent (sometimes with the appearance of fibrinous strands within the cavity; Figure 9), and the hemorrhagic follicle slowly decreases in size over a 3-week to 6-week period until it is no longer apparent.
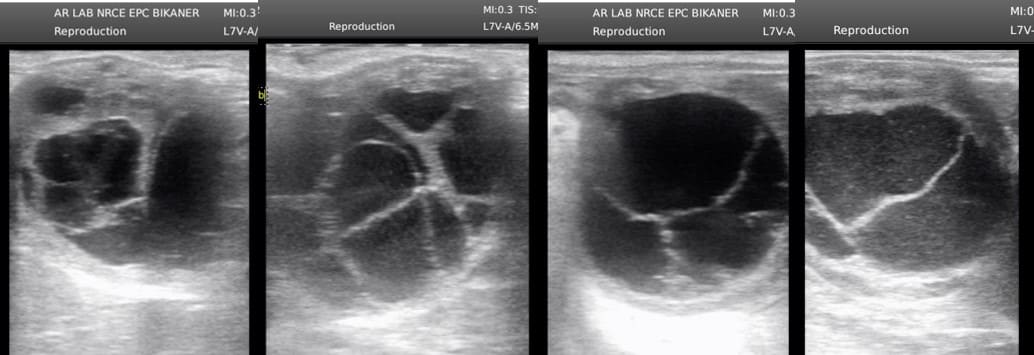
Fig 9 Echogenic fibrinous strands within a follicular lumen early in the progression toward a luteinized anovulatory follicle
The ultrasonic detection and evaluation of corpus luteum (CL) provide valuable information to the diagnostician and theriogenologist. The presence and stage of the luteal gland cannot be ascertained readily during the developing and regressing stages by per rectal palpation.
The CL is first visible on day of ovulation (day 0) as a strongly echogenic, circumscribed mass of tissue (Figure 10 and 10.1). The echogenicity gradually decreases throughout diestrus. However, just prior to regression of the CL the echogenicity decreases. This may reflect changes in luteal hemodynamics.

Fig 10 Formation of Fresh Corpus luteum in the place of ovulated mature follicle
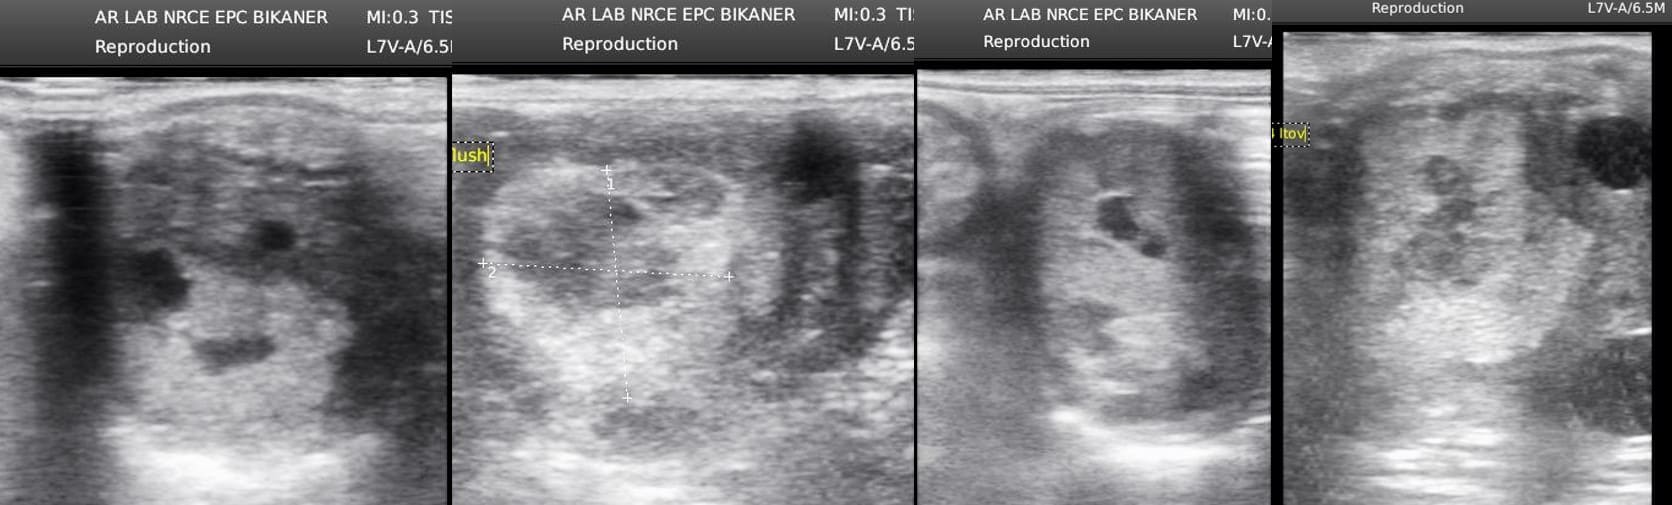
Fig. 10.1 Depiction of ultrasonogram on examination during fresh ovulations. The interior of the former follicular lumen is filled with echogenic material (i.e., clotted blood)
Prolonged Maintenance of the Corpus Luteum
On occasion, the presence of a CL may be seen as a circumscribed, highly echogenic area of tissue in the ovary in mares that failed to return to estrus at the expected time. Prolonged maintenance of the CL is more commonly recognized in normally cycling mares that have been bred. Generally, the mare fails to return to estrus at the expected time, even though she is not pregnant.
During anestrus, cross-section of uterine horns and longitudinal section of uterine body (are often flat and irregular and may contour closely to surrounding abdominal organs (Figure 11). In estrus, uterine horns are well-rounded and both horns and body commonly have an interdigitated pattern of alternating echogenic and non-echogenic areas (Figures 12). The areas of decreased echogenicity are the outer edematous portion of endometrial folds. The edema is due to effects of estrogen. This ultrasonograhic pattern is reminiscent of a sliced orange or cart wheel pattern (Figure 13). Endometrial folds, generally, are visible at the end of diestrus and become more prominent as estrus progresses, then decrease or disappear at approximately the time of ovulation which parallels estrogen production. Endometrial folds will not be distinguishable during diestrus, and were prominent during estrus. Endometrial folds are most prominent 1 or 2 days prior to ovulation. Sometimes, the uterine edema will be high due to estrogen influence and fluid may be seen within the uterine folds which should not be confused with the endometritis (Figure 14)
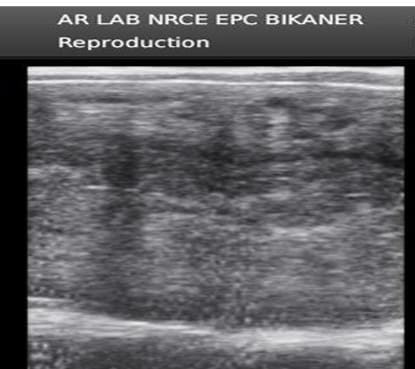
Fig 11 Longitudinal section of uterine body during anestrus
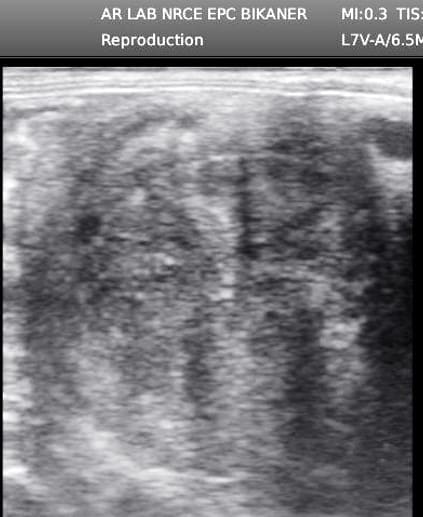
Fig 12 No edema present; individual endometrial folds not discernable homogenous echotexture typical of diestrus or anestrus
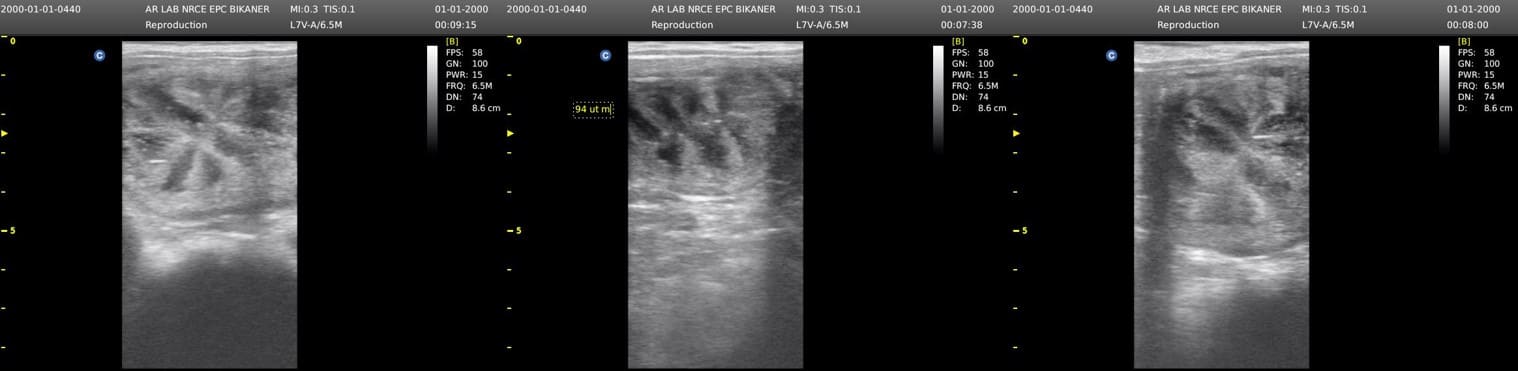
Fig 13 Typical Cart-wheel pattern or cut orange/citrus shape of uterine folds under estrogen influence during mid estrus
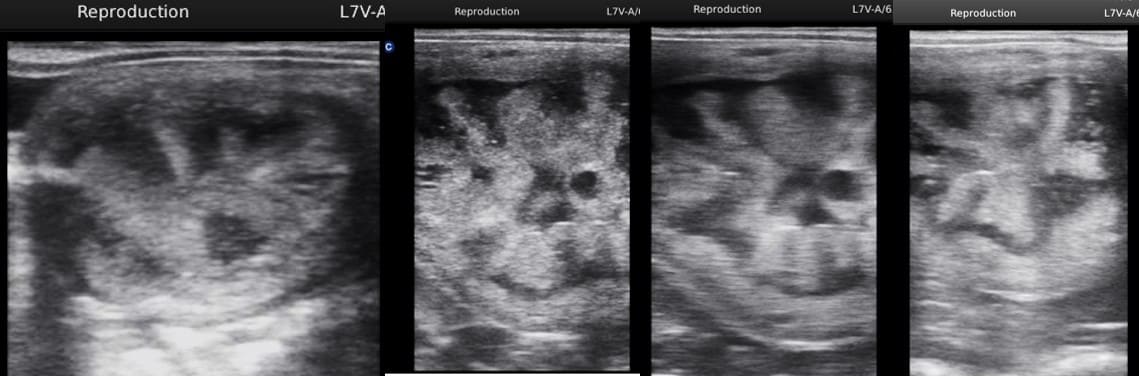
Fig 14 Ultrasonographic image of a uterine horn from a mare in estrus. Presence of endometrial folds in this image is not an indication of endometritis.
When a mare is in diestrus, individual endometrial folds are less distinct, or not discernible, and the echo texture is more homogeneous (Figure 11). When scanning the uterine body, the uterine lumen is often identified by a hyperechogenic white line. This is due to apposition of endometrial surfaces, and probably is caused by specular reflection. In general, during diestrus the entire uterine portion of the reproductive tract is well-circumscribed and defined.
In equines early pregnancy diagnosis is most important especially in the case of a mare which remained empty, as she can be covered in the subsequent cycle, thus avoiding economic loss. Pregnancy diagnosis can be made as early as 14-15 days of the conception. For diagnosis of pregnancy at 10 to 12 days, a 5 or 7.5 MHz transducer is needed. When scanning for an early vesicle, the transducer should be moved slowly so the image or tissue slice visualized (2 to 3 mm wide) is not passed over the vesicle too rapidly. Because the vesicle is moving, it may be found anywhere within the uterine lumen from the tip of a uterine horn to the cranial aspect of the cervix (Figure 15). It should be emphasized that early detection of an embryonic vesicle requires a high frequency transducer (5 MHz) and a high-quality screen. Frequently, ultrasonographic images of a 10- to 14-day vesicle have a bright echogenic line on the dorsal and ventral poles with respect to the transducer (Figure 15). These are not associated with the embryonic disk or other structures of the developing conceptus, but are due to specular reflection. The most common locations for a single embryo or a twin embryo to be missed are the caudal uterine body adjacent to the cervix and the tip of a uterine horn. A common schedule may be initial pregnancy diagnosis at 14–16 days post-ovulation, confirmation of fetal heart beat at 25–35 days, and final confirmation of pregnancy at 45–60 days post-ovulation to monitor fetal viability after initial placental formation.
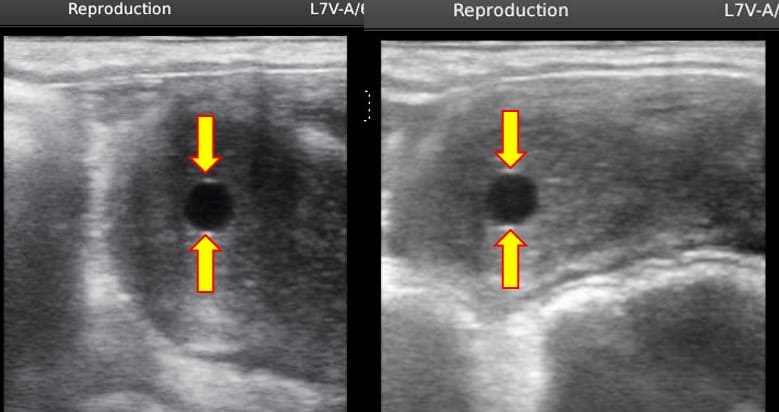
Fig 15 Ultrasonographic image of a 12-day-old pregnancy. Note the presence of dorsal and ventral specular reflection, which is artifactual (arrow).
Day 10-17
An equine embryonic vesicle may be detected as early as day 10 or 11 after ovulation. Small yolk sacs (day 10) are spherical (Figure 16) and found most frequently in the uterine body (Figure 15-18).
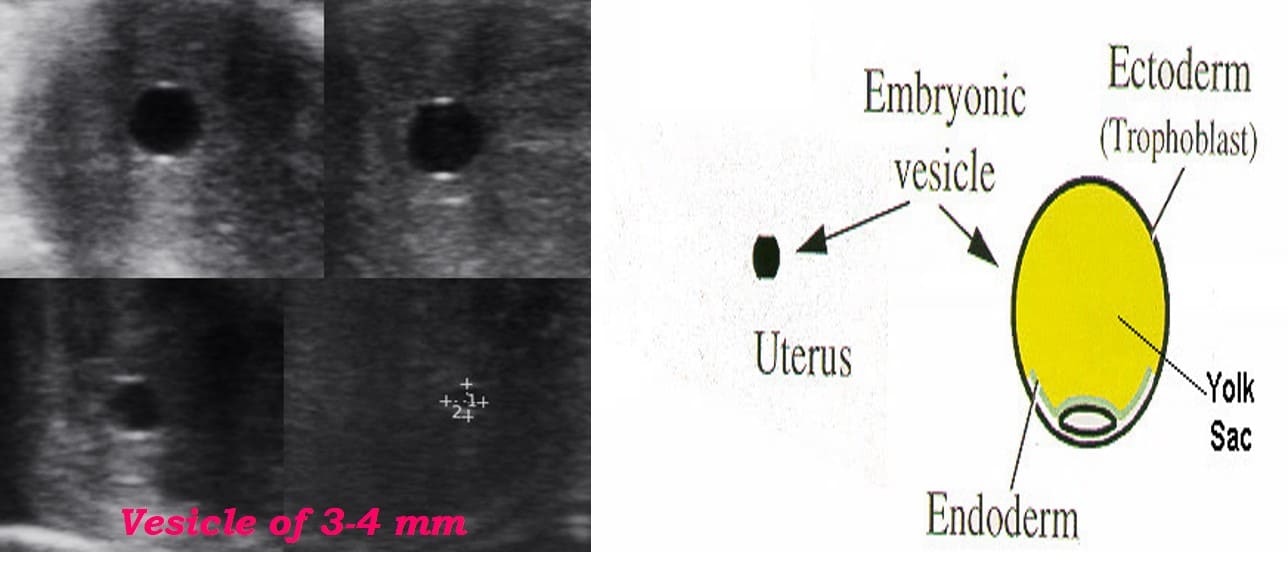
Fig 16 The equine embryonic vesicle can be reliably detected from 10-11d when sufficient anechoic yolk sac fluid has developed.
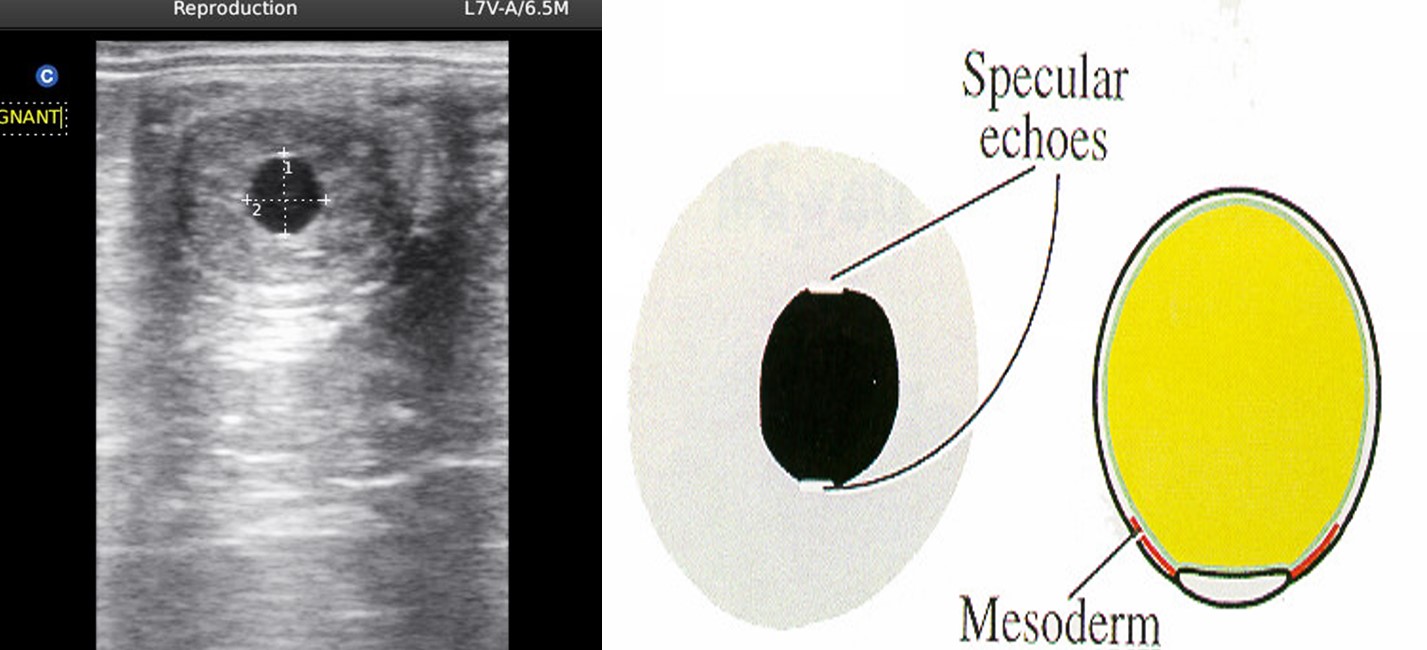
Fig 17 Ultrasonographic image of 14th day embryo. Conceptus is 13 to 18 mm in size and lies centrally in the uterine body.
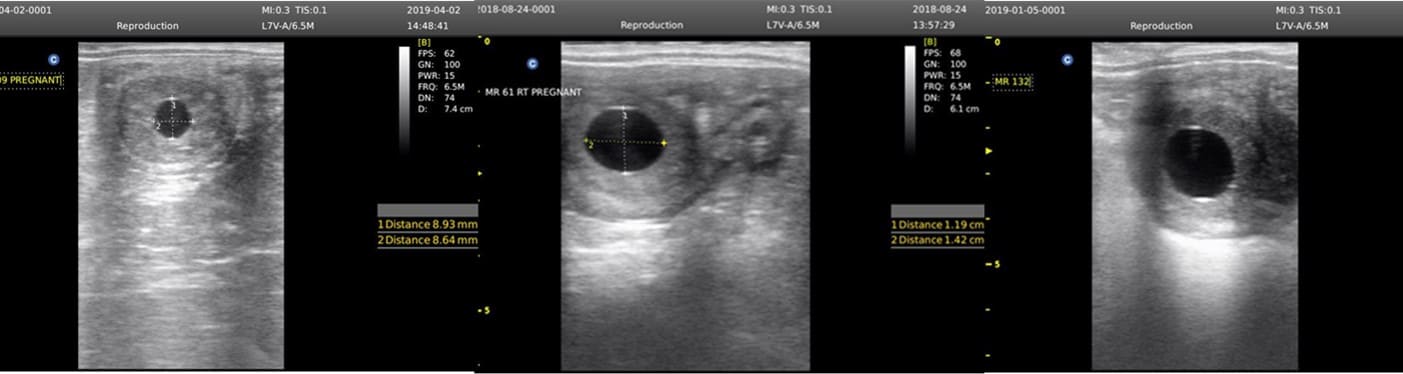
Fig 18 Ultrasonographic image of 14th day embryo. Conceptus is 13 to 18 mm in size and lies centrally in the uterine body.
Day 17-20
The vesicle is spherical in shape before day 17. The vesicle has a growth plateau between days 17 and 26, then growth resumes at a slightly slower rate. After day 17, the vesicle is often irregular in shape (Figures 19). Increasing uterine tone may explain why the vesicle changes shape as pregnancy advances. Fixation generally occurs in the caudal portion of the uterine horn near the bifurcation (corpus corneal junction).
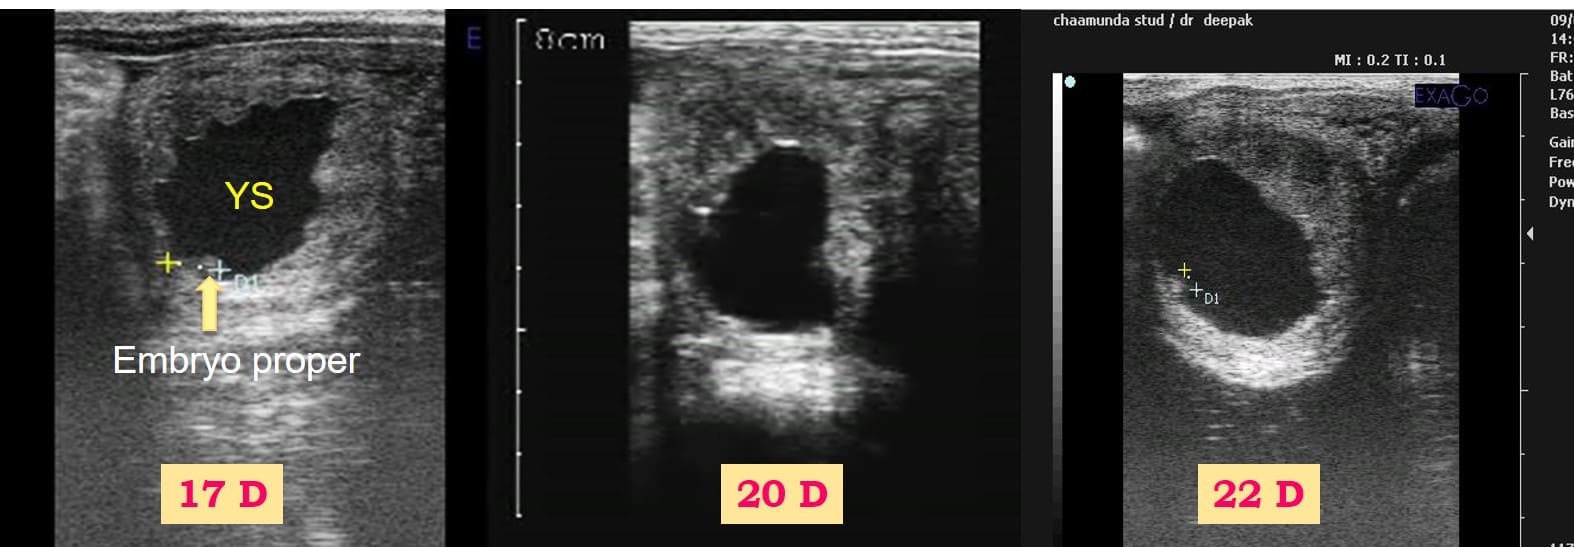
Fig 19 Ultrasonogram of mare pregnancy on day 17 to 22 days. YS; Yolk Sac
Size of the embryo during early gestation in mare
| Stage of Gestation (Days) | |||||||
|---|---|---|---|---|---|---|---|
| 15 | 20 | 25 | 30 | 35 | 40 | 50 | |
| Mean Size ±SD | 1.96±0.50 | 2.73±0.36 | 3.22±0.31 | 3.62±0.27 | 4.42±0.12 | 5.94±0.16 | 8.84±0.11 |
| Table. Size of Vesicle (cm) During Early Gestation | |||||||
| Stage of Gestation (Days) | ||||||
|---|---|---|---|---|---|---|
| 25 | 30 | |||||
| Mean Size ±SD | 1.76±0.59 | 3.22±0.31 | 3.62±0.27 | 4.42±0.12 | 5.94±0.16 | 8.84±0.11 |
| Table. Size of Embryo (cm) During Early Gestation | ||||||
Day 20-45
It is important that the ultrasonographer understands and interprets clinically the growth of the allantois, which is initially recognized on day 24 (Figure 20) and, concurrent with its expansion, the contraction of the yolk sac. The interplay of growth between these two fluid-filled structures results in the embryo moving from the ventral to the dorsal aspect of the vesicle which is called as rise of the embryo to the dorsal part (Figure 21) After day 40 (Figure 22), the yolk sac degenerates and the umbilical cord elongates from the dorsal pole, permitting the fetus to gravitate to the ventral floor where it is seen in dorsal recumbency from day 50 onwards (Figure 22).
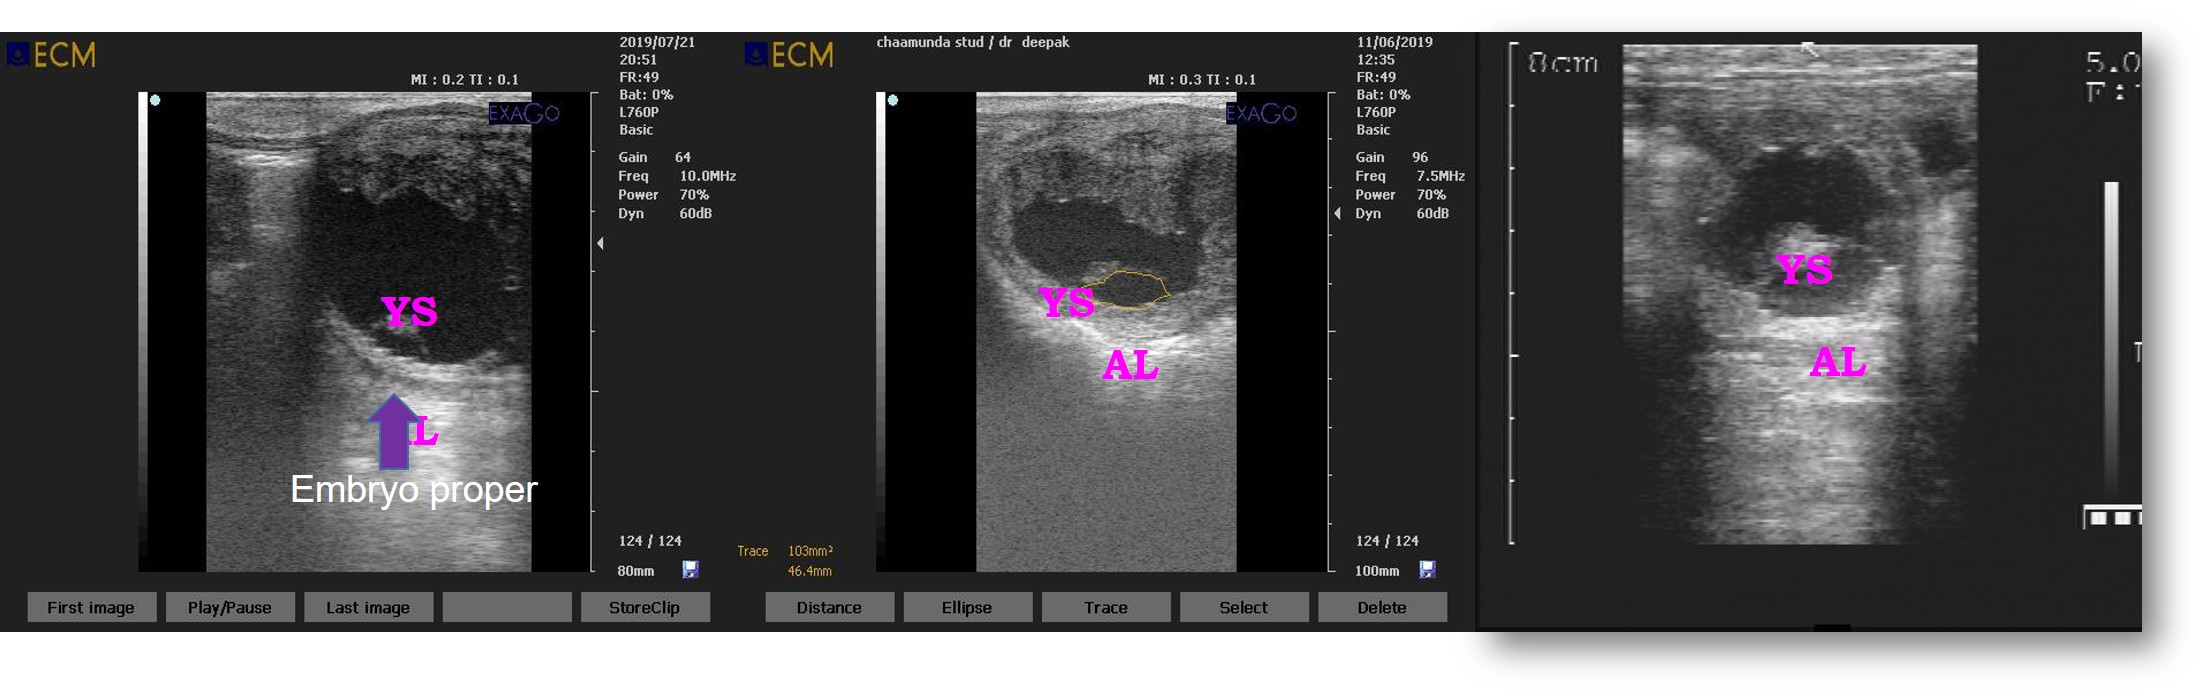
Fig 20 Ultrasonographic image of a 25-28th day-old embryos. Note developing allantois (arrow). YS; Yolk Sac; AL: Allantois
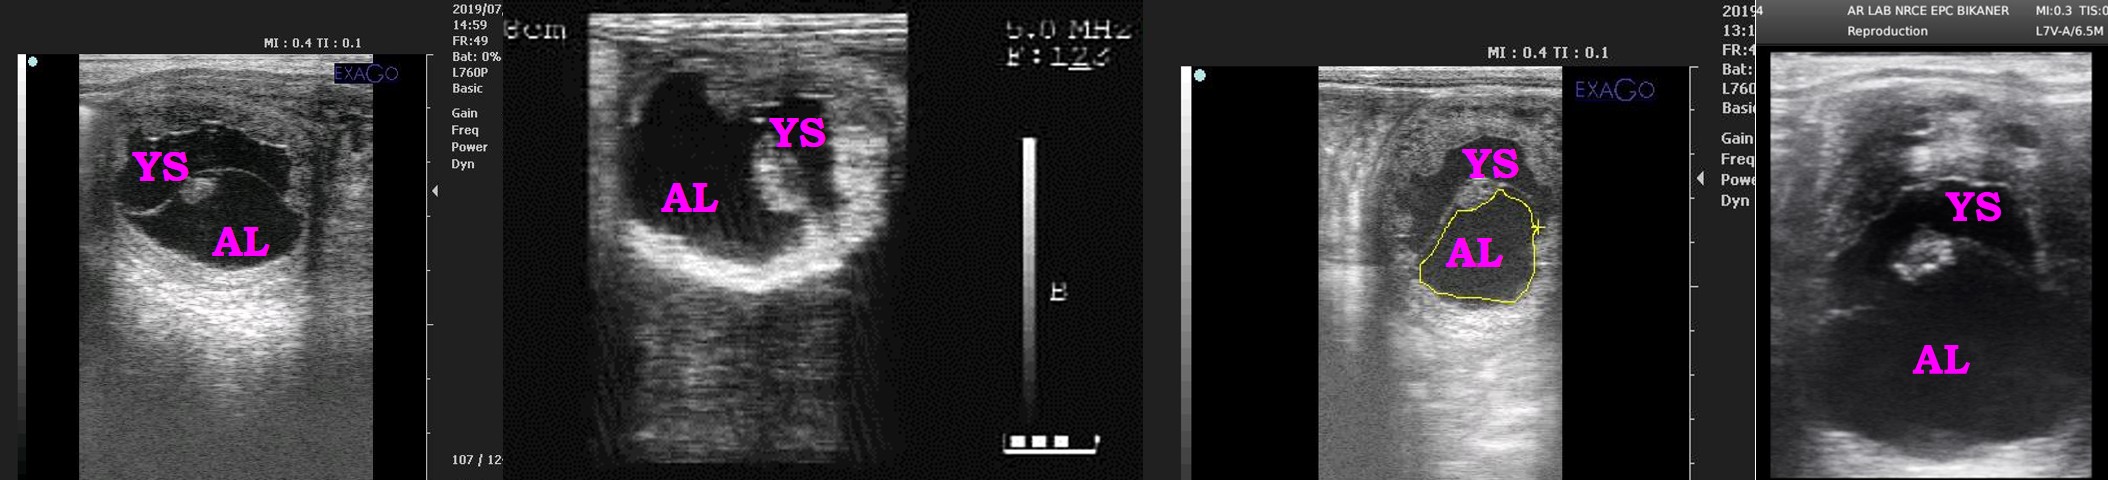
Fig 21 Ultrasonographic image of a 30-day-old pregnancy. Note developing allantois has pushed the embryo (arrow) dorsally, and regression of the yolk sac.
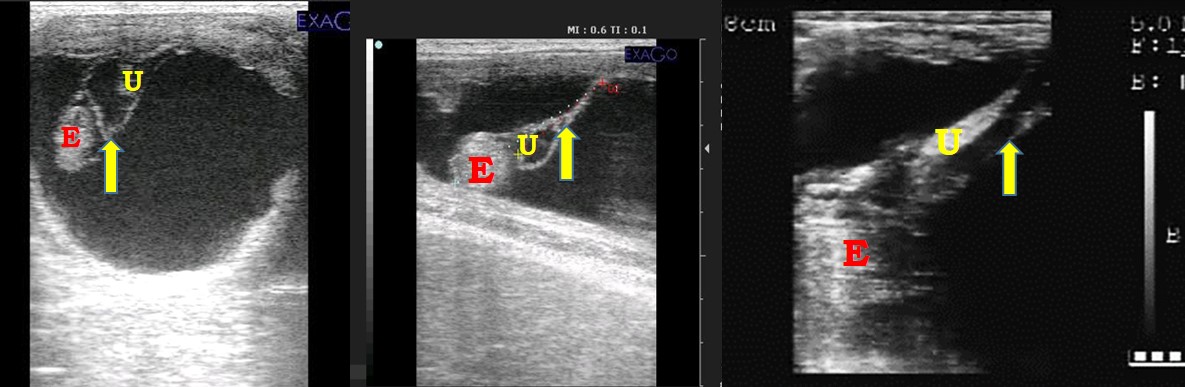
Fig 22 Ultrasonographic images fetus from day 38 till 45 day old fetus. Note developing umbilical cord (arrow). The embryo (E) is positioned near the bottom of the vesicle, and the umbilicus (U) is prominent.
With ultrasonography, the uterus can be examined non-invasively for pathological changes and to monitor therapeutic regimen(s). The three most common forms of uterine pathology detected by ultrasonography are accumulations of intrauterine fluid, air and cysts. Less commonly, fetal remnants, debris and neoplastic conditions are detected.
Intrauterine Fluid
Ultrasonography is extremely valuable for estimating quantity and quality of fluid in the uterine lumen. Rectal palpation is only accurate when quantity of intrauterine fluid is large (> 100 ml) and (or) when uterine tonicity changes. A small volume of anechoic intrauterine fluid during estrus (>2 cm of intraluminal distention) is often seen in reproductively normal mares (Figure 23 A-D). Excessive intrauterine fluid during estrus (2 cm) suggests poor uterine clearance mechanisms and is associated with an increased susceptibility to persistent mating-induced endometritis (Figure 23A). Presence of intrauterine fluid during diestrus (days 1 to 20 post-ovulation) was associated with a significant decrease in day-50 pregnancy rates.
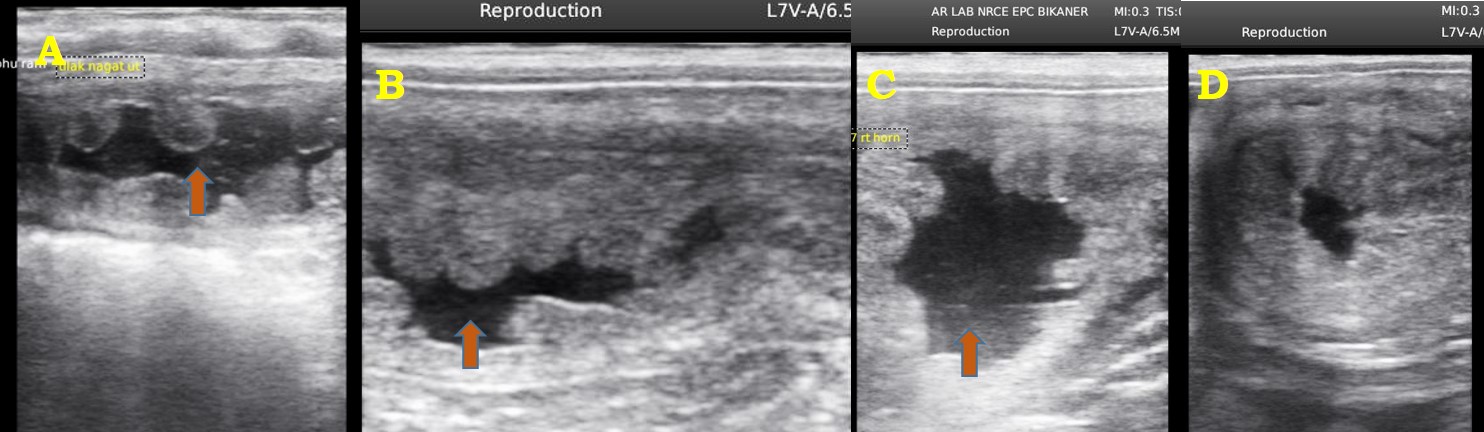
Fig 23 Echogenic fluid within the uterine lumen (arrow).
Endometritis and Pyometra
Appearance or observation of fluid within the uterine lumen during diestrus should be considered abnormal because it is associated with reduced pregnancy rates and increased embryonic losses. Such fluid accumulations are indicative of endometritis (Figure 24) and should be treated accordingly. The degree of fluid echogenicity is related to the concentration of inflammatory cells and debris.
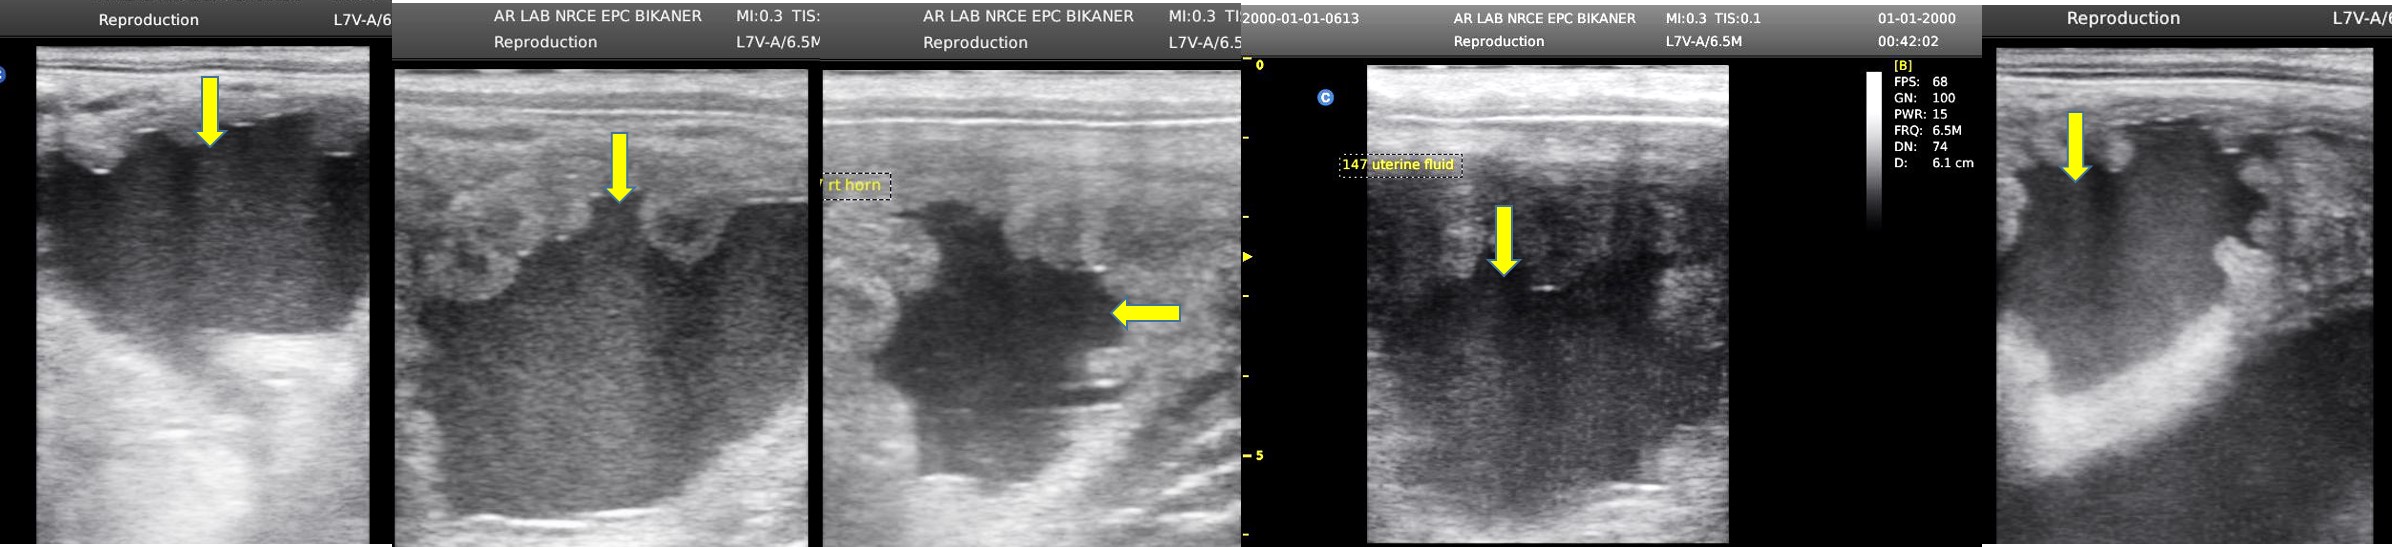
Fig 24 Echogenic fluid within the uterine lumen (yellow arrows). Note the intermediate echogenicity of the fluid, suggesting the presence of inflammatory products and debris.
Pyometra or mucometra can also be easily distinguished from advanced pregnancy with use of ultrasonography because of the lack of uniformly anechoic appearance and the failure to detect an embryo/fetus, umbilicus, or fetal membranes (Figure 25). The contents of the urinary bladder can sometimes be confused with uterine contents with use of transrectal ultrasonography, so distinguishing between the two organs is imperative when performing the examination
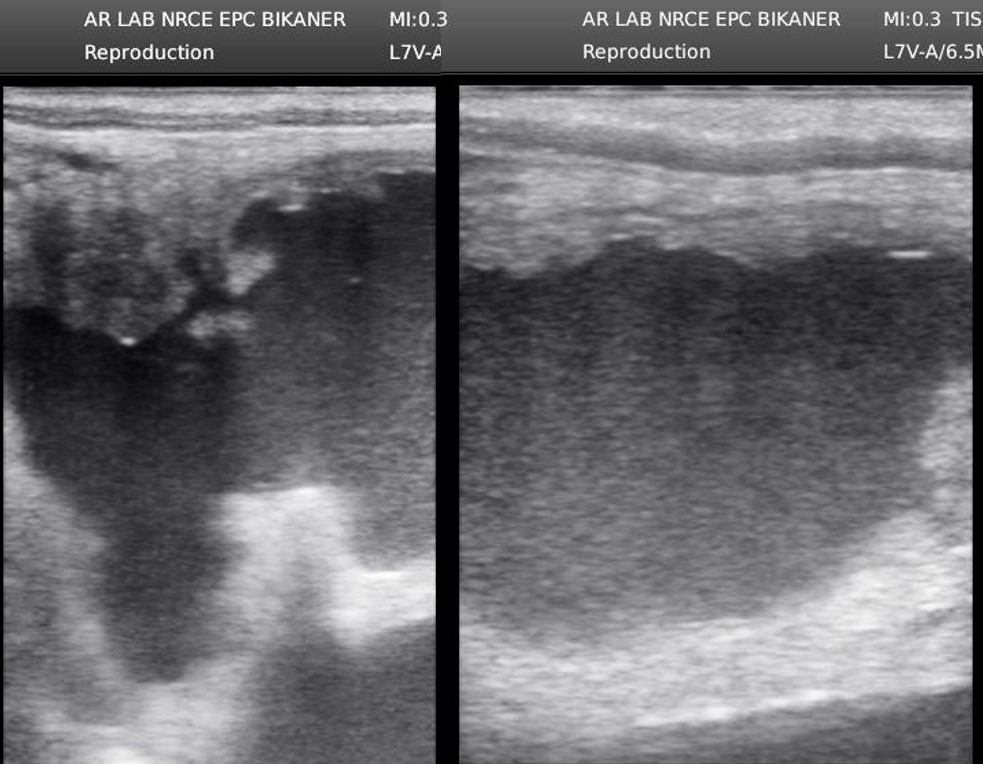
Fig 25 Ultrasonogram of pyometra in mare. Lack of uniformly anechoic appearance and the failure to detect an embryo/fetus, umbilicus, or fetal membranes indicting pyometra.
Uterine Cysts
The prevalence rate of endometrial cysts in mares is fairly high (possibly ranging from 10% to 15% and up to 27%), with the cysts more common in mares older than 10 years. Cysts in the uterus are fluid-filled and apparently have two origins. Endometrial cysts arise from endometrial glands, and are usually < 10 mm in diameter (Figure 26). Their incidence and significance is largely unknown. The second form of uterine cysts are lymphatic in origin and generally are larger than endometrial cysts. They are common in older mares, and have been associated with both normal and abnormal uterine biopsies. The cysts are anechoic but can have hyperechoic trabeculae if they are multilocular.
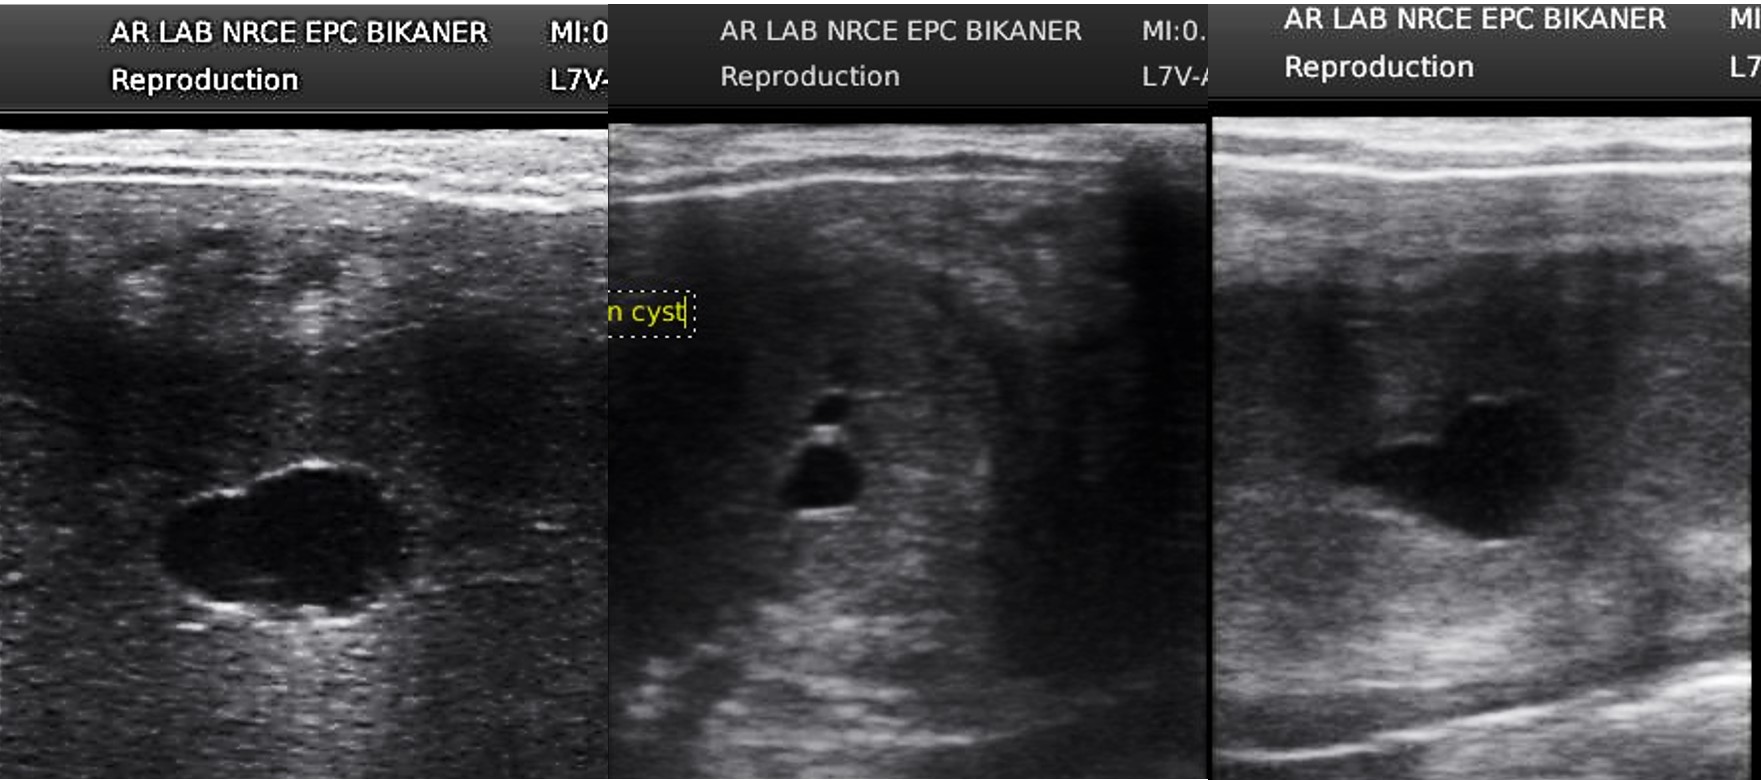
Fig 26 Ultrasonographic image of two-chambered lymphatic cyst in uterine horn of a mare.
Cysts may impede movement of the early conceptus, restricting the reported ability of the vesicle to prevent luteolysis after day 10. Later in pregnancy, contact between the cyst wall and yolk sac or allantois may prevent absorption of nutrients. This may be more important when considering the report that large uterine cysts are more commonly located at the junction of the uterine horn and body, which is the most common site of vesicle fixation. Finally, cysts are commonly indicative of uterine disease.
The ability to noninvasively examine the mare's ovaries permits diagnosis of various forms of ovarian abnormalities and pathology. Some ovarian abnormalities that have been recognized with ultrasonography are
- Multiple, preovulatory follicle
- Anovulatory hemorrhagic follicles;
- Luteinized, unruptured follicles;
- Persistent CLs; and
- Ovarian tumors and periovarian cysts.
Since the mare normally ovulates only one follicle during each estrous cycle, multiple ovulations may be considered an abnormality.
Anovulatory hemorrhagic follicles
Anovulatory hemorrhagic follicles (AHF) are the result of preovulatory follicles growing to an unusually large size (70 to 100 mm), failing to ovulate, then filling with blood and gradually receding The blood in an AHF is distinctly echogenic, whereas normal development of the corpus hemorrhagicum results in a generally non-echogenic central blood clot (15 to 35 mm) (Figure 27). However, both may have criss-crossing fibrin-like strands. The formation of luteal tissue around the periphery of an AHF follicle is rare or minimal.
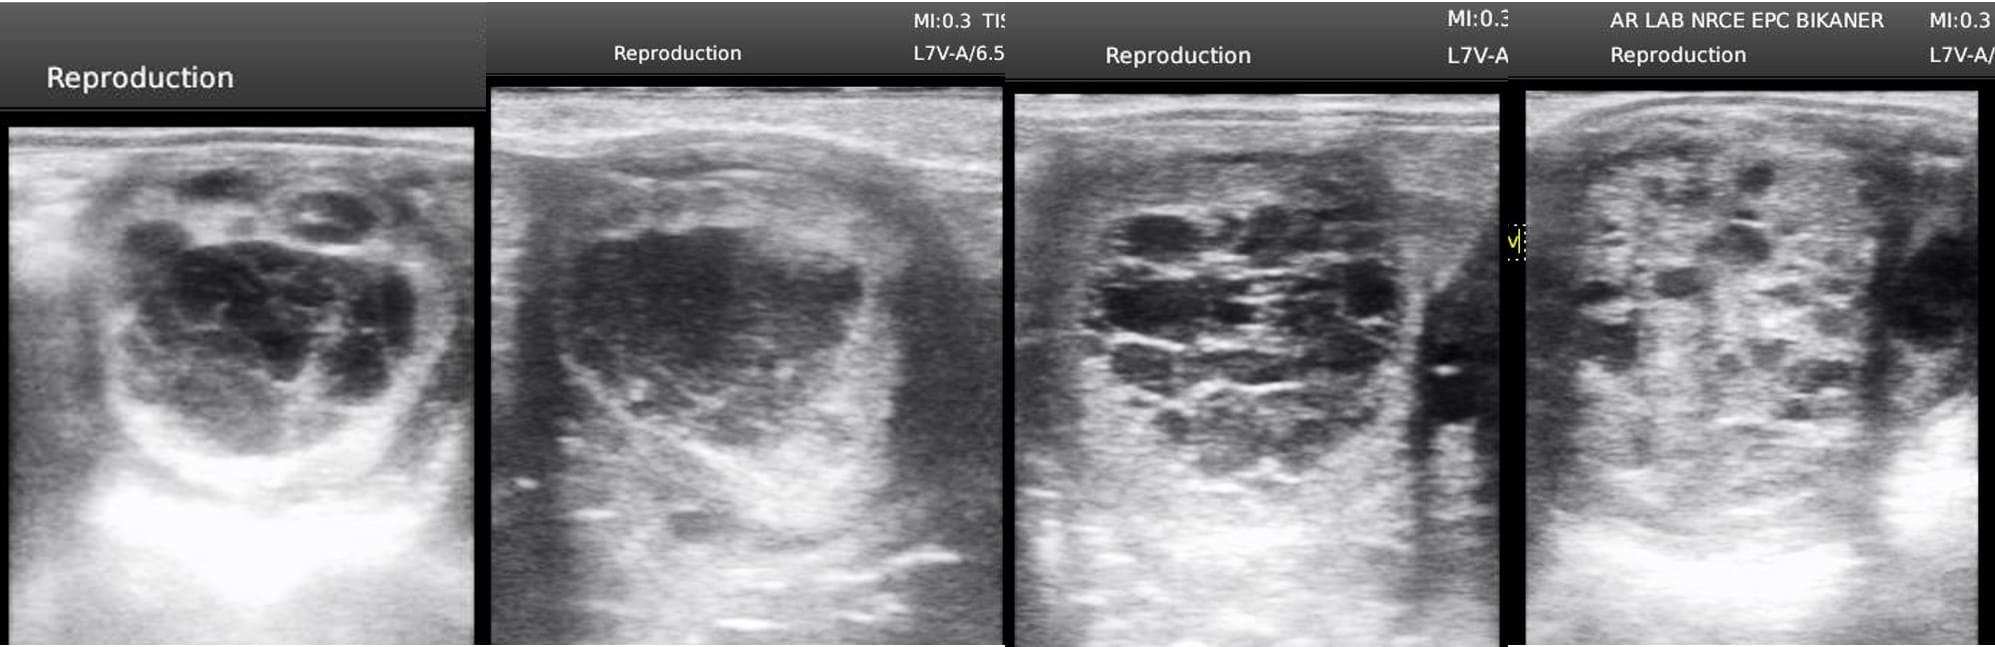
Fig 27 Ultrasonographic image of development of the corpus hemorrhagicum (blood replacing the follicular fluid) sometimes may be turned to become anovulatory.
Granulosa theca cell tumors are usually large, benign, steroid-producing tumors often associated with behavioral changes and poor reproductive performance. The most common history is a barren, anestrous mare. Other clinical signs are intermittent or continuous estrus, nymphomania or stallion like behavior. Gross characteristics may be solid or cystic The ultrasonographic appearance of granulosa cell tumors is quite variable, depending on structure and composition. They may be uniformly echogenic (if the tumor is solid), heterogeneous with a honeycomb appearance (if the tumor is multicystic) (Figure 28 A), or largely hypoechoic or anechoic (if the tumor consists primarily of a single fluid-filled cyst). Hypoechoic or anechoic granulosa cell tumors are usually quite large with a thick (up to 1 to 2 cm), echo dense wall and are sometimes stippled with echogenic material (Figure 28 A-E) (probably clotted blood because the tumors are highly vascularized). Palpation may reveal a smooth surface, a knobby, hard surface, or sometimes a soft surface with obvious follicular development. The unaffected ovary is usually inactive.
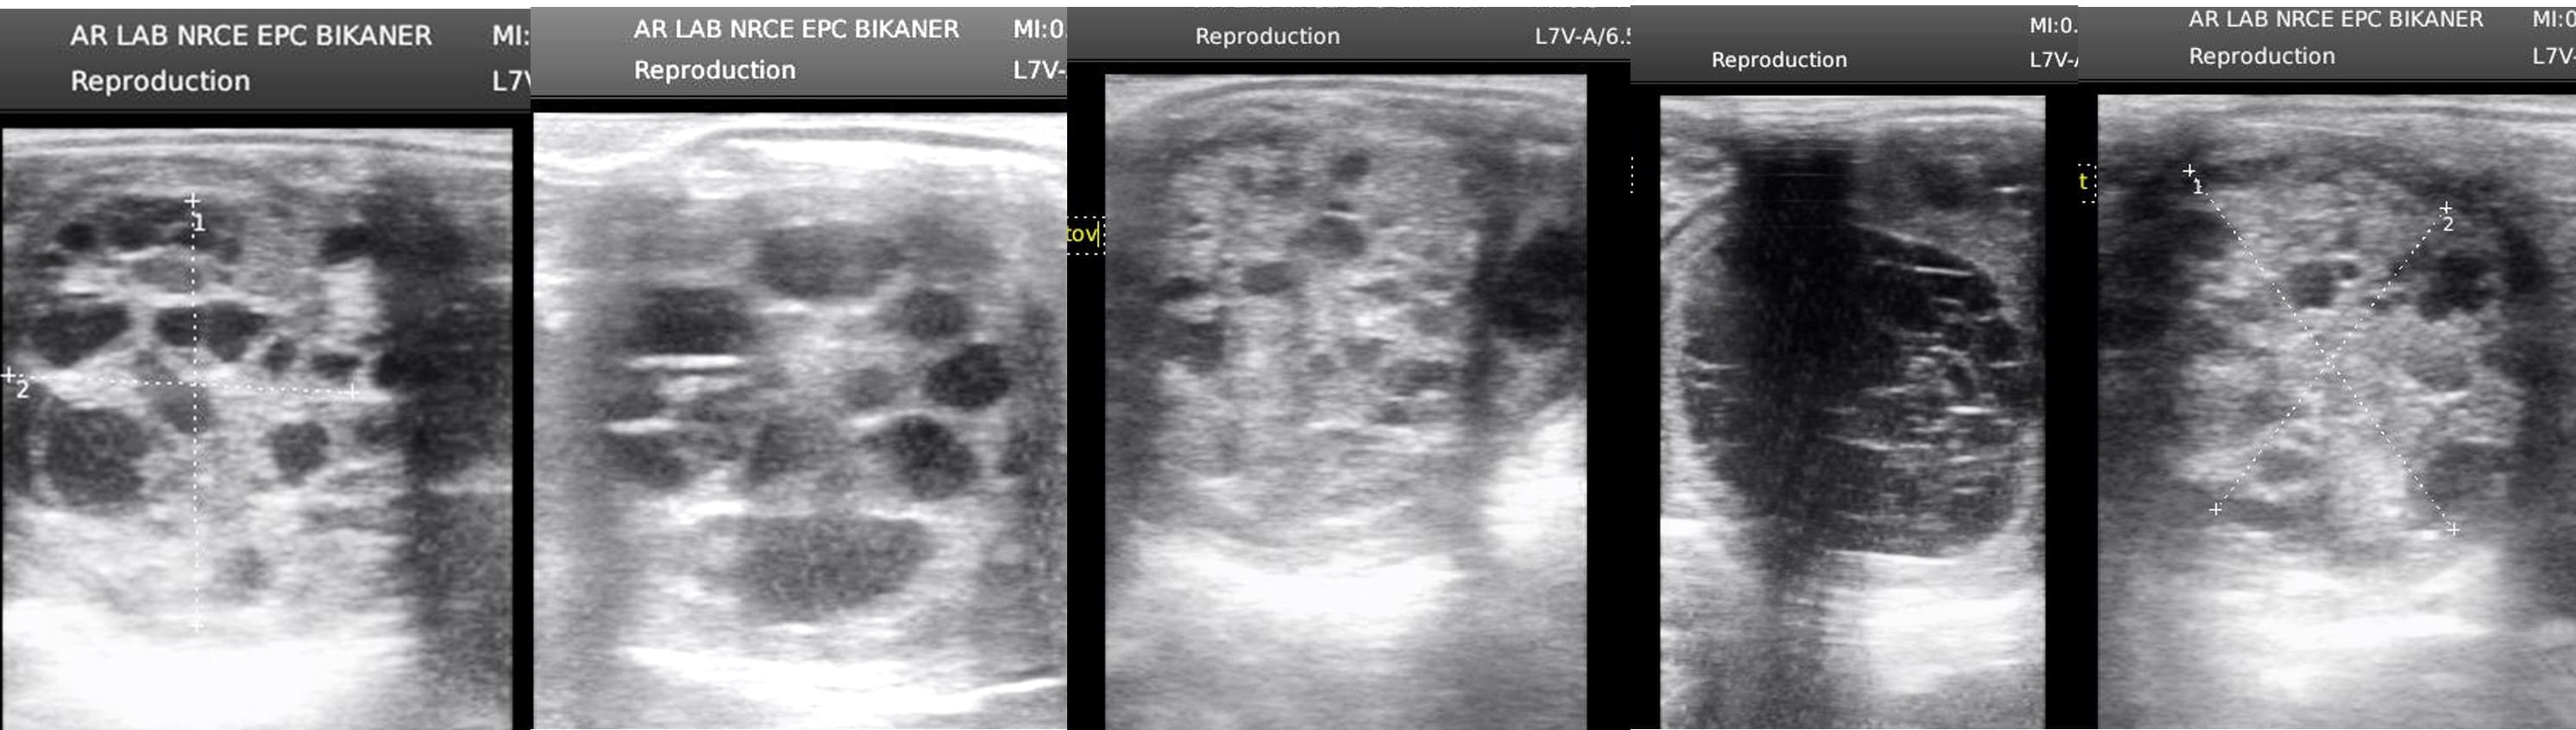
Fig 28 Ultrasonographic image of heterogeneous with a honeycomb appearance
As discussed above, the benefits of ultrasound as a diagnostic imaging procedure in animal reproduction are numerous. Importantly, routine examinations have been shown to have no harmful biological effects. Ultrasound is considered a safe procedure for the animal, the operator and nearby personnel, allowing it to be performed in any location without the need for specific safety precautions. It is non-invasive and therefore well tolerated in animals, making serial examinations, such as to monitor progression of the condition, response to treatment or to practice scanning techniques, possible.
Ultrasound is a wave form of non-ionising energy. It has no relation to X-rays, which damage tissues because of their ionising effect on living cells. The low intensity of pulsed ultrasound used for diagnostic purposes and in the Doppler devices designed for foetal monitoring produces no significant heating. Compared with other diagnostic aids as X-rays, ultrasound is considered very safe, with no harmful bio effects.